Age-Standardized Rate Calculator
Calculate age-standardized rates online from Excel or CSV data. Apply standard populations and compare crude versus adjusted rates with AI.
Or try with a sample dataset:
Preview
What Is Age Standardization?
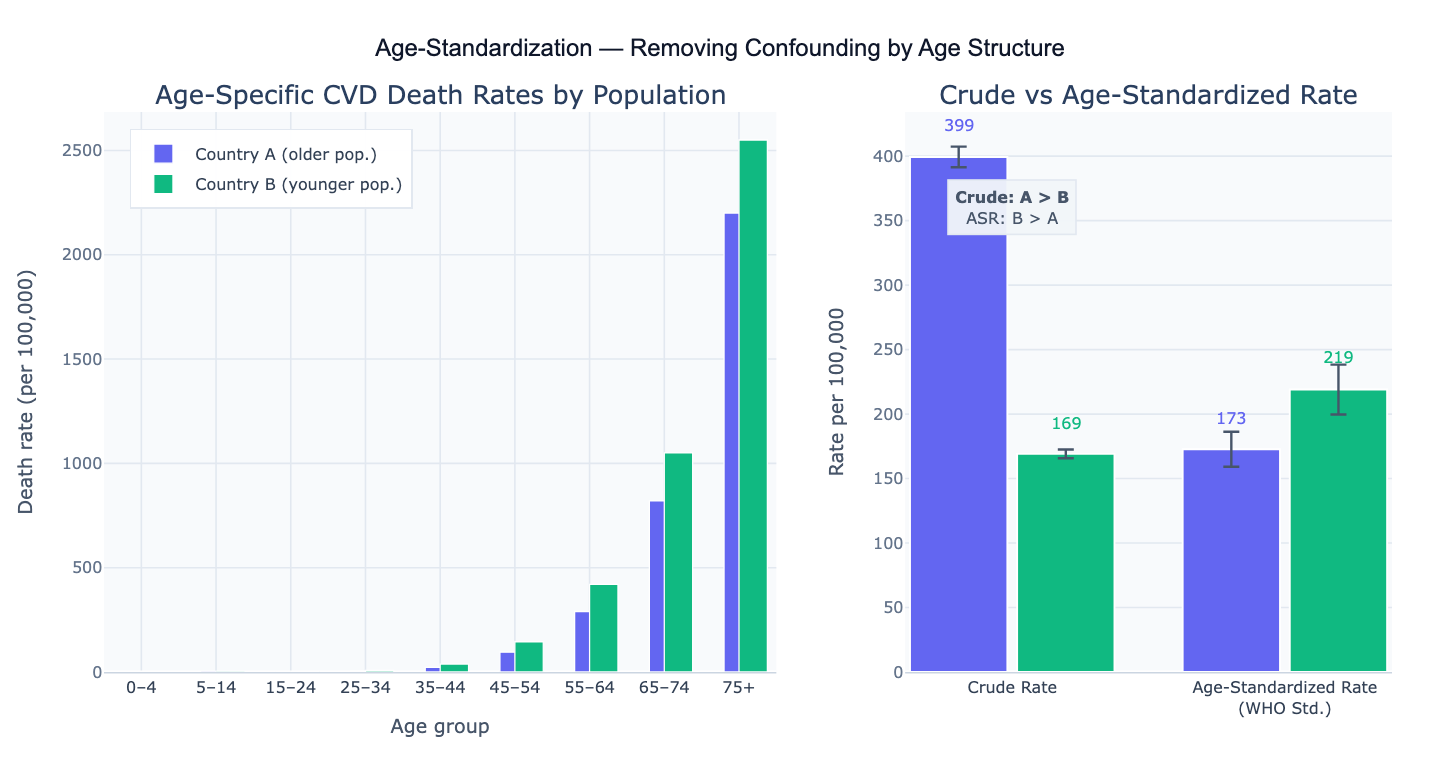
Age standardization (also called age adjustment) is a method for removing the confounding effect of age when comparing disease rates, mortality rates, or other health metrics across populations that have different age structures. Because most diseases occur more frequently in older people, a population with a higher proportion of elderly individuals will have a higher crude rate even if the underlying age-specific risk is identical across the two populations. Age standardization produces a hypothetical rate that would be observed if each population had the same age structure (the "standard population"), making the two groups directly comparable.
There are two methods of age standardization: direct standardization and indirect standardization. In direct standardization, you multiply each age-specific rate from your study population by the proportion of each age group in a standard reference population (such as the WHO 2000 World Standard Population or the US 2000 Standard Population), then sum across all age groups: ASR = Σ (rate_i × w_i), where rate_i is the age-specific rate in stratum i and w_i is the weight (proportion) of age group i in the standard population. In indirect standardization, you apply a reference population's age-specific rates to your study population to compute the expected number of events, then form the Standardized Mortality Ratio (SMR) = observed / expected. Direct standardization is preferred when age-specific rates are available; indirect standardization is used when study populations are small and age-specific rates are unstable.
A classic example: Country A has a crude cardiovascular disease (CVD) death rate of 250 per 100,000, while Country B has a crude rate of 190 per 100,000. But Country A has an older population. After direct standardization to the WHO standard population, Country A's age-standardized rate is 175 per 100,000 and Country B's is 205 per 100,000 — the ranking reverses, revealing that Country B actually has higher underlying CVD risk once age structure is removed from the comparison. Without age standardization, this reversal (Simpson's paradox) would be invisible.
How It Works
- Upload your data — provide a CSV or Excel file with columns for age group, event count (deaths, cases, etc.), population size, and optionally a group column if comparing multiple populations. The AI will compute age-specific rates from counts and population denominators.
- Describe the analysis — e.g. "age-standardize cancer mortality rates using WHO 2000 standard population; compare crude vs adjusted rates for regions A and B; bar chart of age-specific and standardized rates"
- Get full results — the AI writes Python code using pandas and Plotly to merge your data with the standard population weights, compute age-specific rates, apply direct standardization, calculate 95% confidence intervals, and produce comparison charts
Required Data Format
| Column | Description | Example |
|---|---|---|
age_group | Age stratum label | 0-4, 5-14, 15-24, ... 75+ |
events | Number of events (deaths, cases) | 12, 8, 45 |
population | Person-years or mid-year population | 52000, 61000, 48000 |
group | Optional: population/region label | Country A, Region 1 |
standard_pop | Optional: custom standard weights | If omitted, WHO 2000 or US 2000 is used |
Any column names work — describe them in your prompt. If you already have age-specific rates (rather than counts), specify that and the AI will skip the rate calculation step.
Interpreting the Results
| Output | What it means |
|---|---|
| Crude rate | Total events / total population × 100,000 — unadjusted for age structure |
| Age-specific rates | Event rate within each age stratum — the inputs to standardization |
| Age-standardized rate (ASR) | Weighted average of age-specific rates using standard population weights |
| 95% CI on ASR | Confidence interval assuming Poisson-distributed event counts |
| Standardized Rate Ratio (SRR) | ASR of group 1 / ASR of group 2 — relative difference between two populations |
| SMR | Observed events / expected events (indirect method) — ratio > 1 means higher-than-expected risk |
| Expected events | Age-specific reference rates × study population — denominator of SMR |
| Percent change (crude → adjusted) | How much the rate changes after removing age confounding — indicates direction of age confounding |
Example Prompts
| Scenario | What to type |
|---|---|
| Basic direct standardization | age-standardize mortality rates using WHO 2000 standard; report crude and adjusted rates with 95% CI |
| Two-group comparison | compare age-standardized CVD rates between males and females; plot side-by-side bars with CI error bars |
| US vs WHO standard | compute age-adjusted rates using both US 2000 and WHO 2000 standard populations; compare the two adjustments |
| SMR calculation | indirect standardization vs national reference rates; compute SMR and 95% CI for each region |
| Trend over time | age-standardized rates by year from 2000 to 2020; line chart showing trend with crude rates for comparison |
| Custom standard population | use provided standard population weights in 'std_weight' column; apply direct standardization |
| Multiple causes | age-standardize separately for heart disease, cancer, and stroke; grouped bar chart for all three |
Assumptions to Check
- Sufficient events per age stratum — age-specific rates are unstable when counts are very small (< 5 events per stratum); consider collapsing adjacent age groups to stabilize rates, or use indirect standardization (SMR) when the study population is small
- Standard population choice — different standard populations (WHO 2000, US 2000, European Standard Population) give different ASRs; always specify which standard population was used and compare to the same standard when making cross-study comparisons; the WHO 2000 standard is the international default for global comparisons
- Same age group boundaries — both the study data and the standard population must use identical age group definitions; mismatched boundaries (e.g., 0–4 in the study vs. 0–1 and 1–4 in the standard) require interpolation, which introduces error
- Poisson assumption for CIs — confidence intervals on age-specific rates assume Poisson-distributed event counts; for very rare events the exact Poisson CI is preferred over the normal approximation; for large counts (> 100 per stratum) the normal approximation is adequate
- Independent age groups — direct standardization weights are proportions of the standard population and must sum to 1.0; verify that your standard population weights are correctly normalized before applying them
Related Tools
Use the Survival Curve Generator and Cox Proportional Hazards Model for time-to-event analyses that adjust for age and other covariates at the individual level — age standardization is a population-level method while Cox regression is an individual-level approach. Use the Meta-Analysis Calculator to pool age-standardized rates across multiple studies, accounting for between-study heterogeneity. Use the Chi-Square Test Calculator to test whether the difference in crude rates between two groups is statistically significant before deciding whether age standardization changes the conclusion. Use the Power Analysis Calculator to determine sample size needed to detect a given difference in age-standardized rates.
Frequently Asked Questions
When should I use direct vs indirect standardization? Use direct standardization when: you have reliable age-specific rates for your study populations (sufficient events per stratum); you want to produce a summary rate that can be directly compared across multiple groups; you are producing official public health statistics. Use indirect standardization (SMR) when: your study population is small and age-specific rates are unstable due to sparse counts; you want to compare to a well-established national or international reference; you are analyzing occupational cohorts or disease registries where the study population is well-defined but small. The SMR is more stable with small numbers but is harder to compare across studies with different reference populations.
What is the WHO 2000 World Standard Population? The WHO 2000 World Standard Population is a reference age distribution created by WHO based on the average world age structure around the year 2000. It consists of proportions for 18 five-year age groups from 0–4 to 85+. Because it is internationally standardized, using it allows direct comparison of age-standardized rates across all countries and time periods — a study from Brazil using the WHO 2000 standard produces an ASR directly comparable to a study from Sweden using the same standard. The US 2000 Standard Population is an alternative used by the US CDC for domestic comparisons; it produces slightly different ASRs because the US age distribution differs from the global average. Always report which standard population you used.
Why does my age-standardized rate differ from published figures? Common reasons for discrepancies: (1) Different standard population — WHO 2000 vs US 2000 vs European Standard Population give different ASRs; (2) Age group boundaries — some sources use 0–4, 5–9, ..., 85+ while others use 0–14, 15–44, 45–64, 65+; (3) Population denominator — mid-year population vs person-years at risk; (4) Event definition — underlying cause of death vs contributing cause; (5) Reference year — rates are often published with 2–3 year lag. Always compare methods and standard populations to reconcile differences before reporting.
How do I interpret a Standardized Mortality Ratio (SMR) of 1.4? An SMR of 1.4 means the study population experienced 40% more deaths than expected based on the reference population's age-specific death rates applied to the study population's age structure. An SMR > 1 indicates excess mortality; SMR < 1 indicates lower-than-expected mortality. The SMR's 95% confidence interval determines whether the excess is statistically significant: if the CI excludes 1.0, the difference is significant at the 5% level. When the CI includes 1.0 (e.g., SMR = 1.4, 95% CI: 0.9–2.1), the excess could be due to chance. Always report the observed and expected event counts alongside the SMR, as a ratio of 14/10 and 140/100 both give SMR = 1.4 but carry very different statistical weight.