Chi-Square Test Calculator for Excel & CSV
Run chi-square tests of independence and goodness-of-fit online from Excel or CSV data. Build contingency tables, p-values, and effect sizes with AI.
Or try with a sample dataset:
Preview
What Is a Chi-Square Test?
A chi-square test is a statistical test used to determine whether there is a significant association between two categorical variables (test of independence) or whether an observed frequency distribution matches a theoretically expected distribution (goodness-of-fit test). Unlike t-tests and ANOVA which compare means of numeric variables, chi-square operates entirely on counts — how many observations fall into each combination of categories.
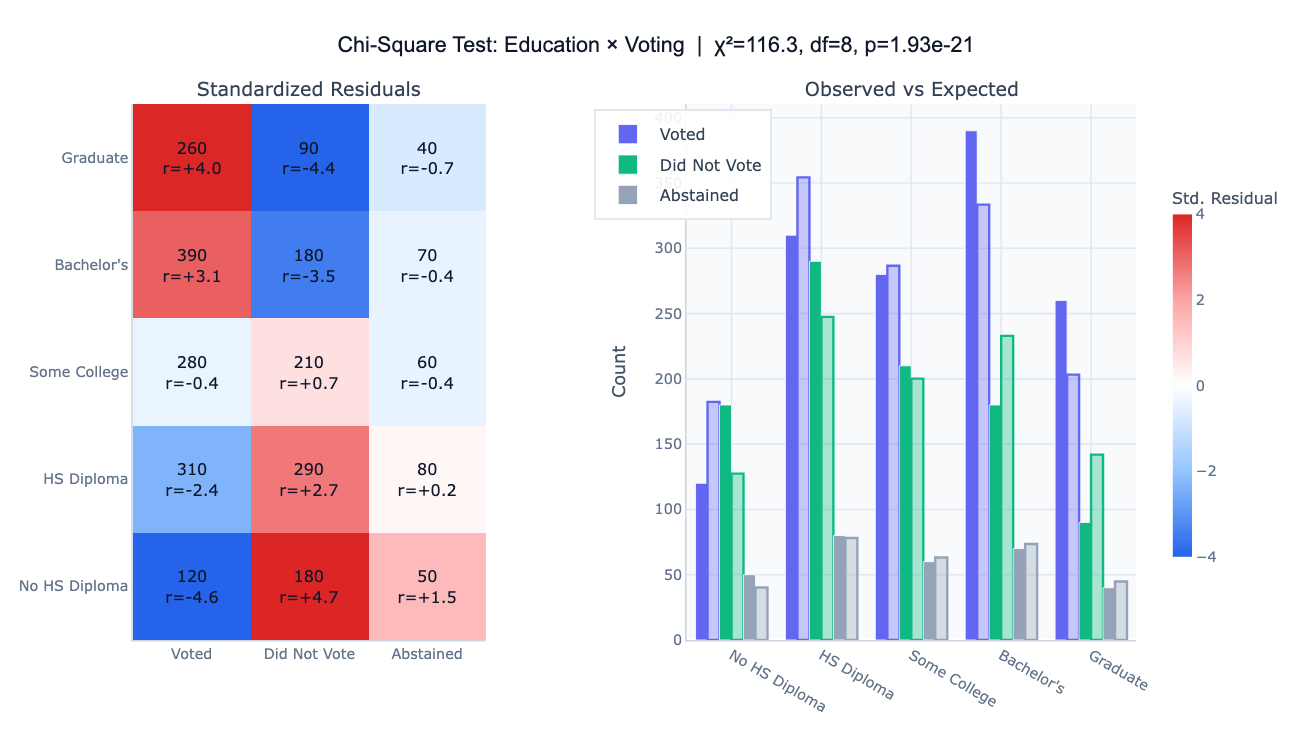
The test of independence is the more common form. It asks: are two categorical variables related, or are they independent? For example, is there a relationship between a person's education level and their voting behavior? To answer this, you build a contingency table (cross-tabulation) of observed counts and compare it to the counts you would expect if the variables were completely independent. The larger the discrepancy between observed and expected counts, the larger the chi-square statistic (χ²), and the smaller the p-value. A p-value below your threshold (usually 0.05) indicates a statistically significant association.
The goodness-of-fit test asks whether an observed distribution across categories matches a specified theoretical distribution — for example, whether a die is fair (each face appearing 1/6 of the time), or whether product defects are evenly distributed across production lines. The standardized residuals from either test reveal which cells contribute most to the chi-square statistic — large positive residuals mean a cell has far more observations than expected; large negative residuals mean far fewer. This cell-level diagnosis, often visualized as a heatmap, is as informative as the overall p-value.
How It Works
- Upload your data — provide a CSV or Excel file with at least two categorical columns (for a test of independence) or one column of observed counts with expected proportions specified in the prompt. One row per observation, or a pre-aggregated contingency table.
- Describe the test — e.g. "chi-square test of independence between income group and healthcare access, show standardized residuals and Cramér's V"
- Get full results — the AI writes Python code using scipy to compute the test statistic, p-value, and effect size, and Plotly to visualize the contingency table and residuals
Interpreting the Results
| Output | What it means |
|---|---|
| χ² statistic | Sum of (observed − expected)² / expected across all cells — larger means more deviation |
| Degrees of freedom | (rows − 1) × (columns − 1) for independence test |
| p-value | Probability of observing this χ² or larger if the variables are truly independent |
| Cramér's V | Effect size (0 = no association, 1 = perfect association) — independent of sample size |
| Standardized residual | (observed − expected) / √expected — values beyond ±2 indicate a notable cell |
| Red cell in heatmap | More observations than expected — these categories tend to co-occur |
| Blue cell in heatmap | Fewer observations than expected — these categories tend not to co-occur |
Example Prompts
| Scenario | What to type |
|---|---|
| Association test | chi-square test of independence between gender and product preference, show contingency table |
| Survey analysis | chi-square test: is satisfaction level independent of department? Cramér's V and residuals |
| Goodness of fit | chi-square goodness-of-fit test: are defects equally distributed across 5 production lines? |
| Medical research | chi-square test of independence between treatment group and recovery outcome |
| Marketing | chi-square test: does click-through rate differ by ad category? Show expected vs observed |
Assumptions to Check
- Random sampling — observations should be independently drawn from the population
- Categorical variables — both variables must be categorical (nominal or ordinal); chi-square does not apply to numeric variables
- Expected cell counts ≥ 5 — each cell in the expected table should have at least 5 observations; if not, ask the AI to apply Yates' correction or Fisher's exact test
- Mutually exclusive categories — each observation should belong to exactly one category in each variable
- Sufficient sample size — at least 20–30 total observations is a practical minimum; very small samples need Fisher's exact test instead
Related Tools
Use the Online t-test calculator when your outcome variable is numeric and you are comparing means between two groups. Use the Online ANOVA calculator when comparing numeric means across three or more groups. Use the AI Heatmap Generator to visualize a pre-computed correlation or association matrix without running a statistical test.
Frequently Asked Questions
What is the difference between the chi-square test of independence and goodness-of-fit? The test of independence uses two observed categorical variables from your data to test whether they are associated with each other. The goodness-of-fit test uses one observed categorical variable and compares it against a specified expected distribution (e.g. equal proportions, or proportions from a prior study). Describe which you want in your prompt and the AI will run the appropriate version.
My p-value is significant — what does Cramér's V tell me? A significant p-value only tells you that an association exists; it says nothing about how strong it is. With a large sample, even a tiny, practically meaningless association can be statistically significant. Cramér's V measures effect size: V < 0.1 is negligible, 0.1–0.3 is small, 0.3–0.5 is moderate, and > 0.5 is strong. Always report both.
Some of my expected cell counts are below 5 — what should I do? Chi-square is unreliable when expected counts are small (< 5). Options: (1) combine rare categories, (2) use Fisher's exact test (ask the AI to run it instead — it's exact for any cell size), or (3) apply Yates' continuity correction for 2×2 tables.
Can I run chi-square on a pre-aggregated contingency table rather than raw data? Yes — if you already have a table with rows and columns of counts, upload it and tell the AI "this is already a contingency table, not raw observations". The AI will skip the cross-tabulation step and run chi-square directly on the table.
What's the difference between standardized residuals and adjusted residuals?Standardized residuals = (observed − expected) / √expected. Adjusted (standardized Pearson) residuals further account for the marginal totals, making them more interpretable: adjusted residuals > ±2 indicate a cell that is significantly different from expected, similar to a z-score. Ask for "adjusted residuals" for more precise cell-level inference.