AI Chart Generator for Excel & CSV
Create charts online from Excel and CSV data with AI. Build bar, line, scatter, pie, and custom charts in seconds.
Or try with a sample dataset:
Preview
How It Works
Upload a CSV or Excel file, describe the chart you want in plain English, and Keptune generates Python code using Plotly to produce an interactive chart — no coding required.
- Upload your data — CSV, XLSX, or XLS files up to 50 MB
- Describe your chart — e.g. "scatter plot of revenue vs. expenses, colored by region"
- Get an interactive chart — zoom, pan, hover for values, and download as PNG
The AI interprets your column names and data types automatically, so you don't need to format your file in any special way.
What You Can Build
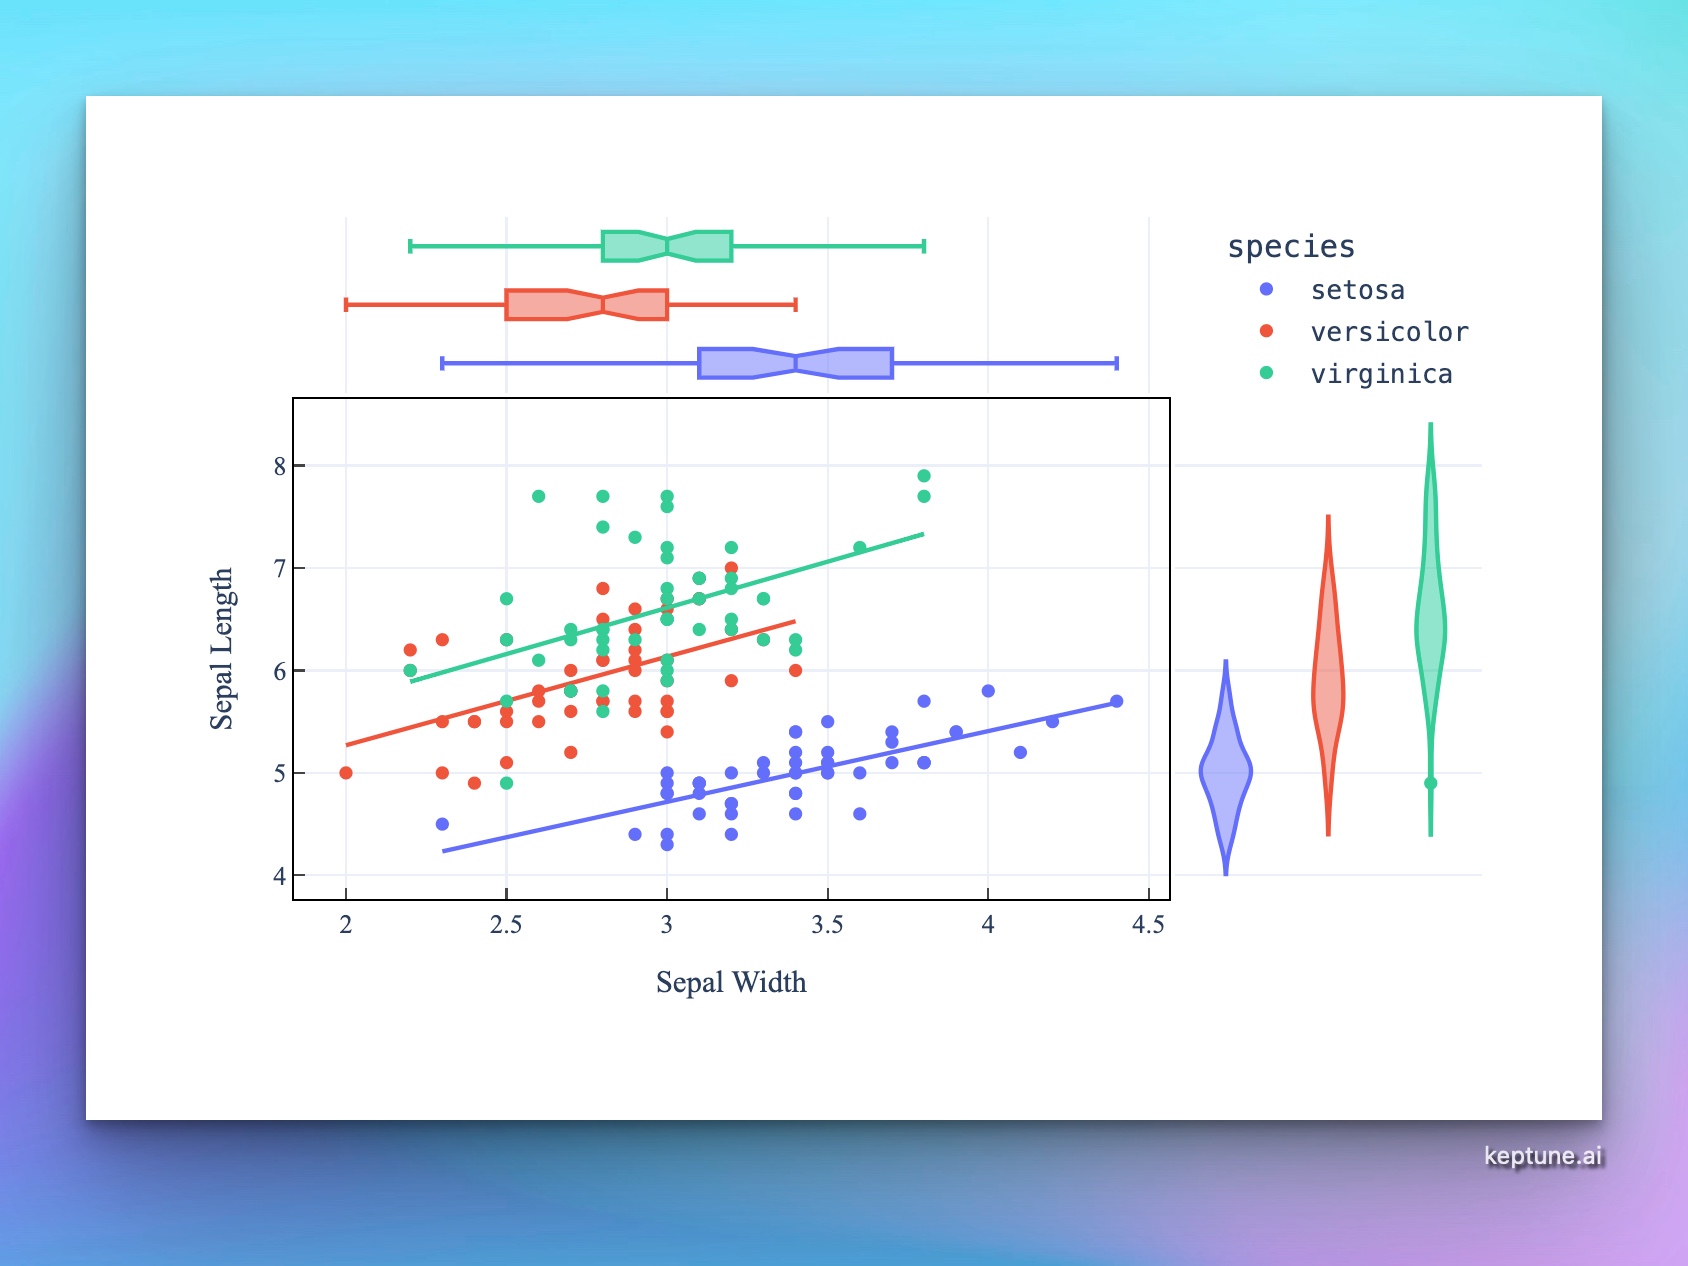
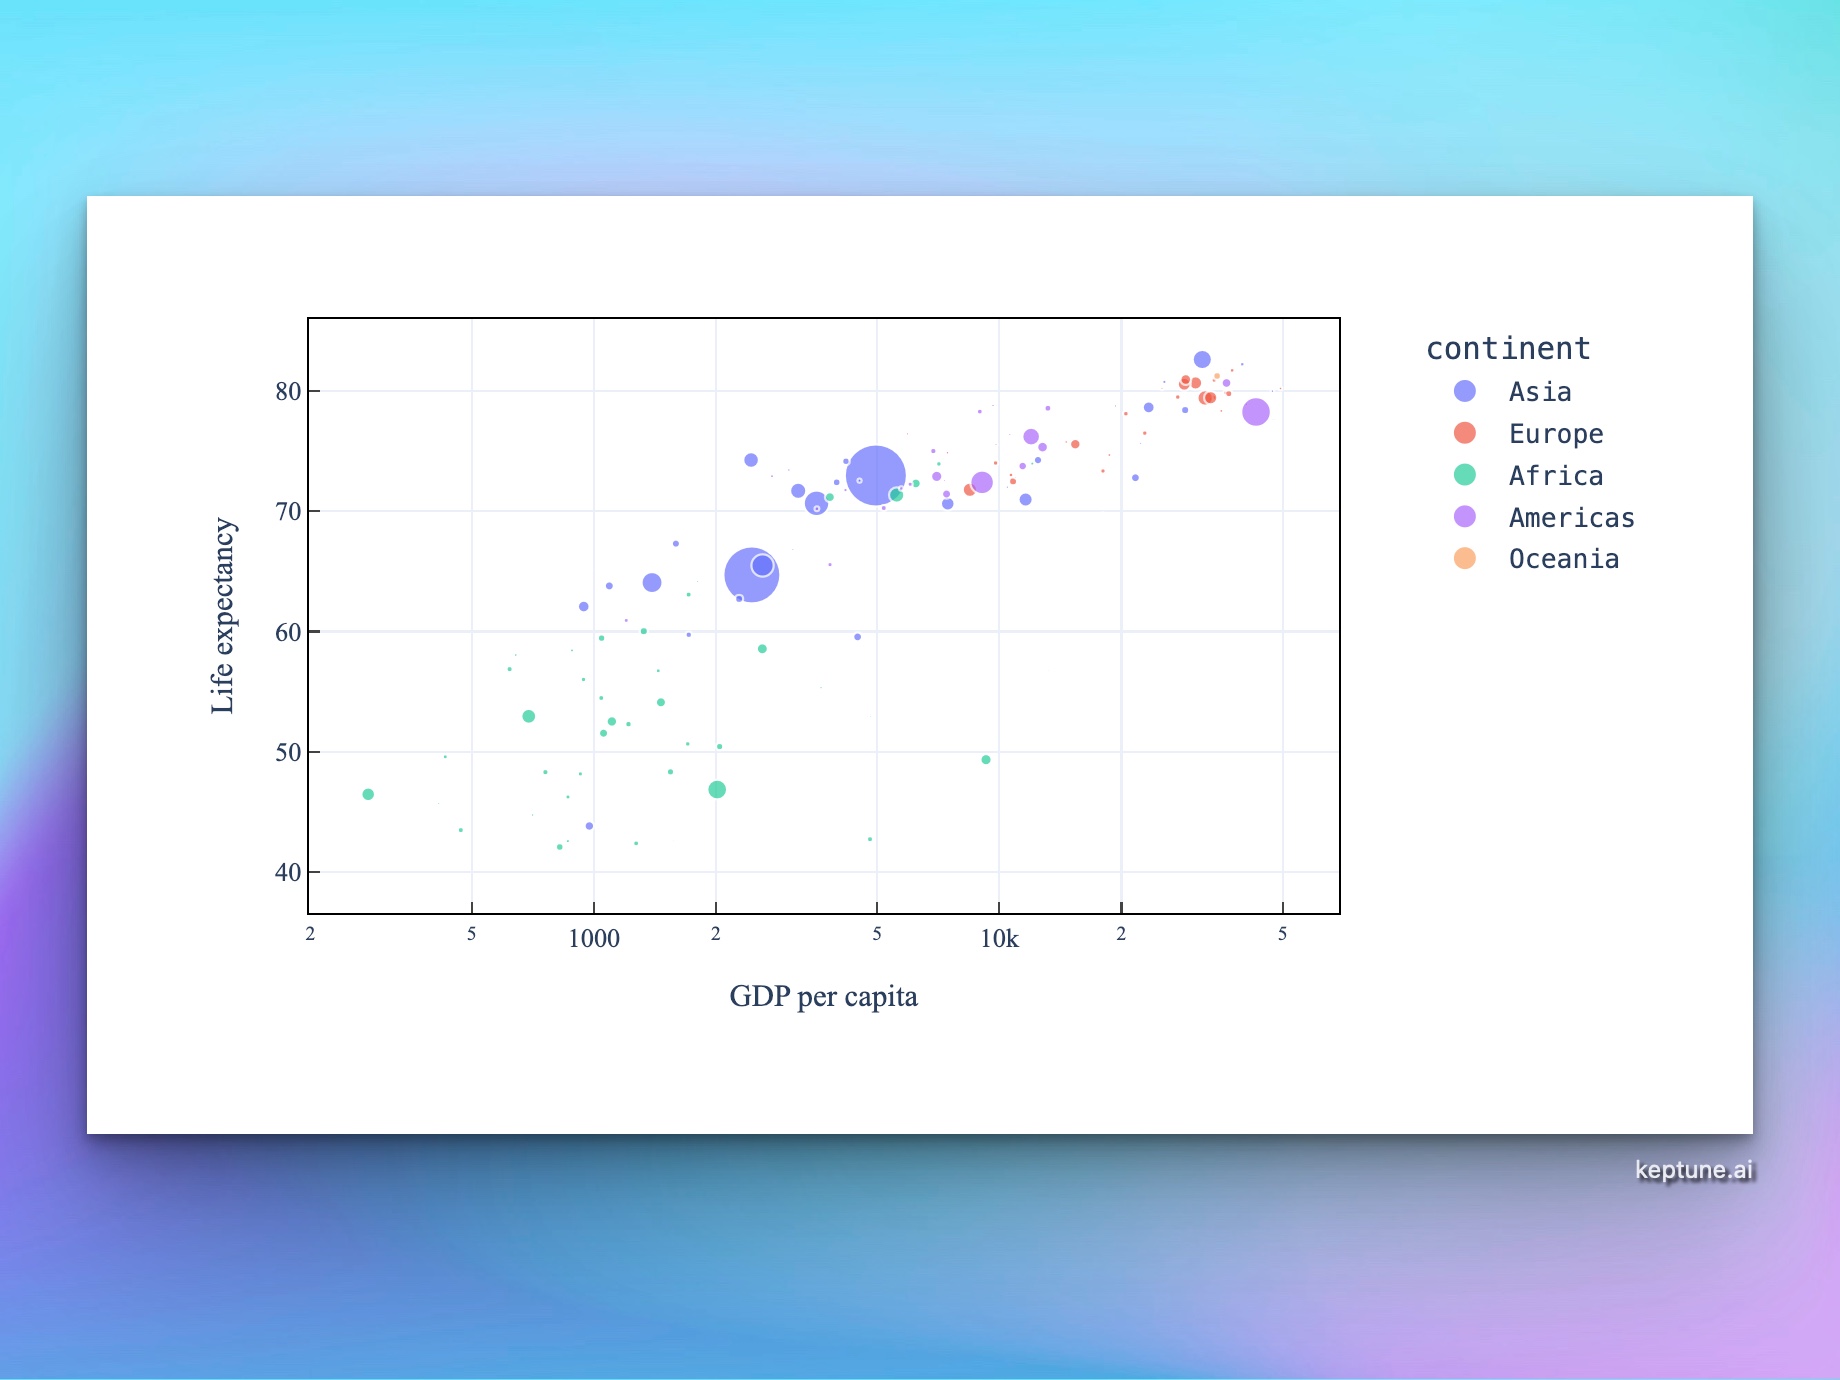
- Scatter plots — spot correlations and outliers in your data
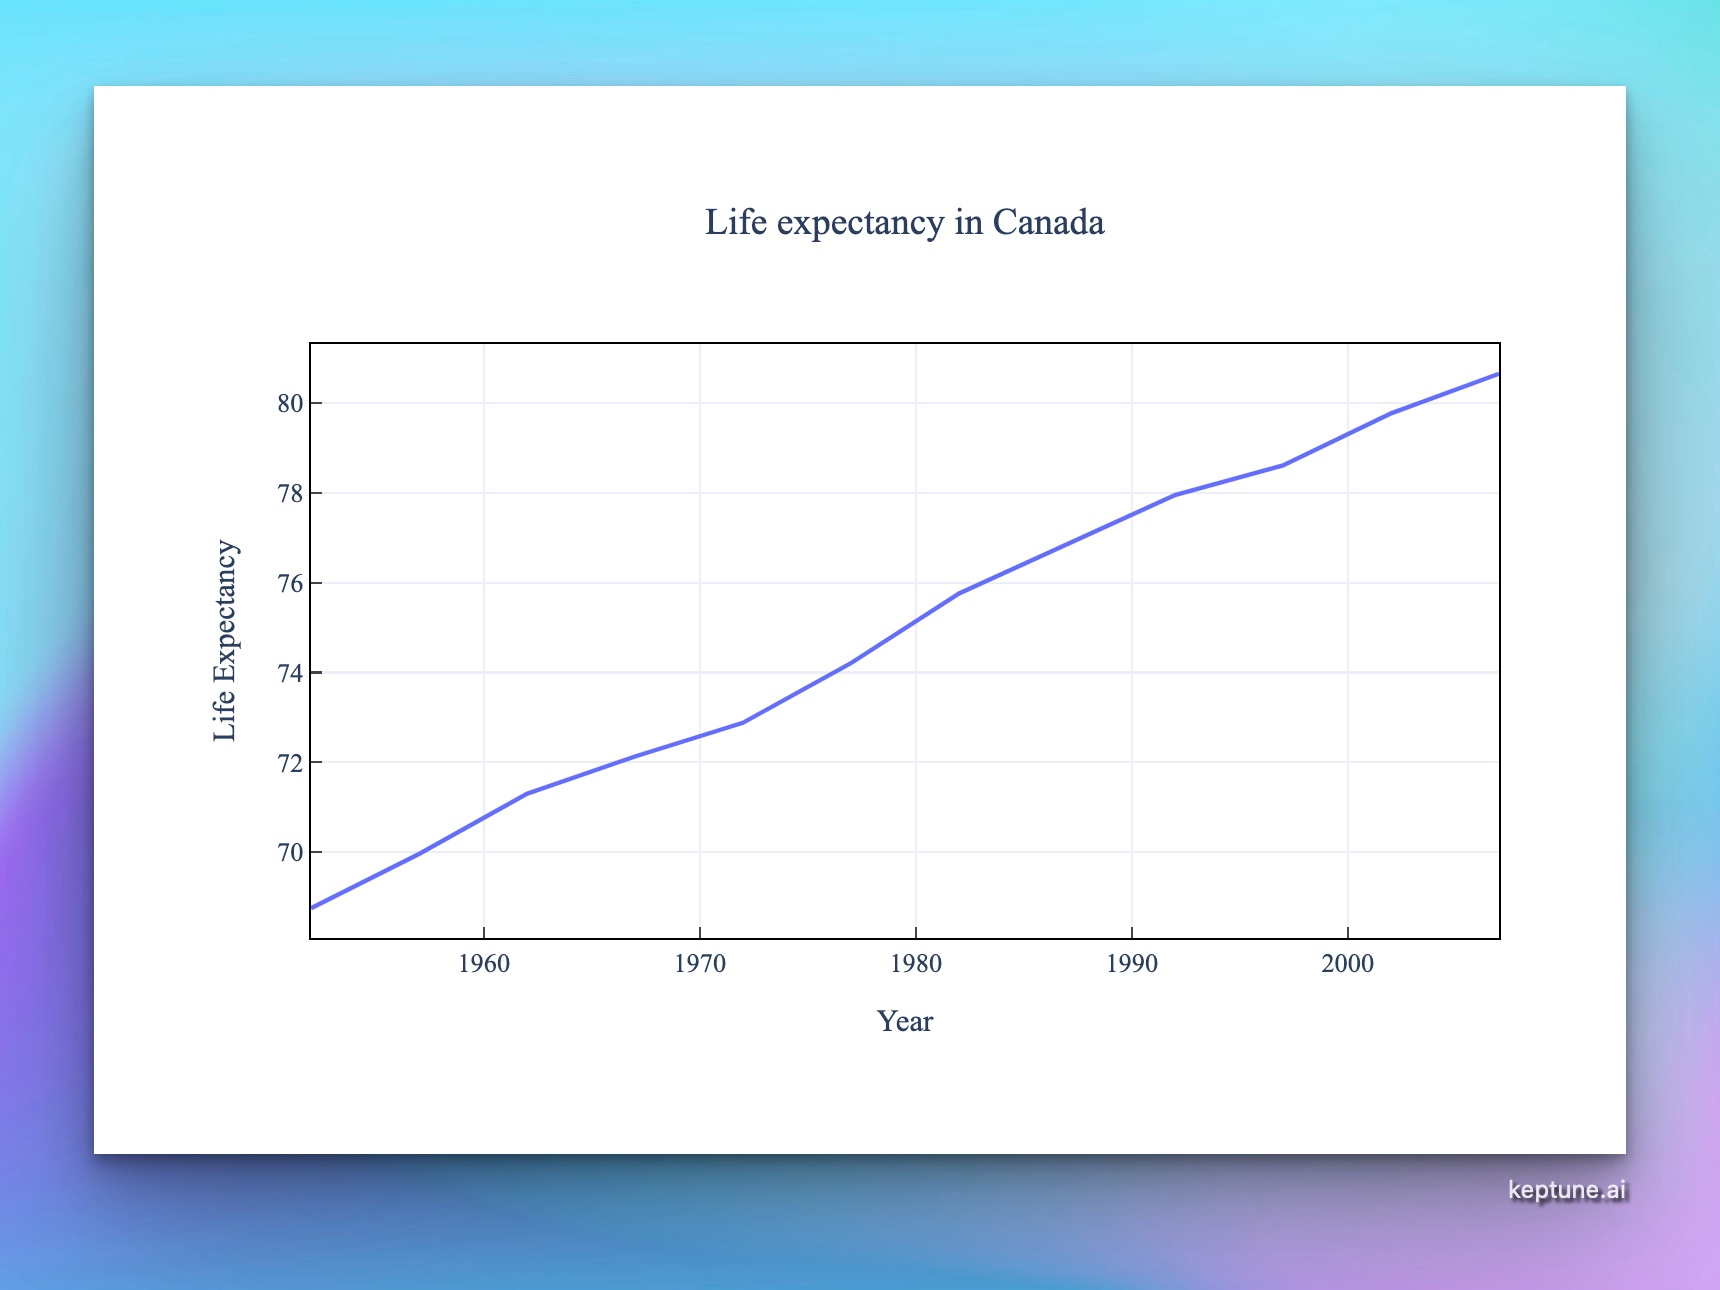
- Line charts — visualize trends over time
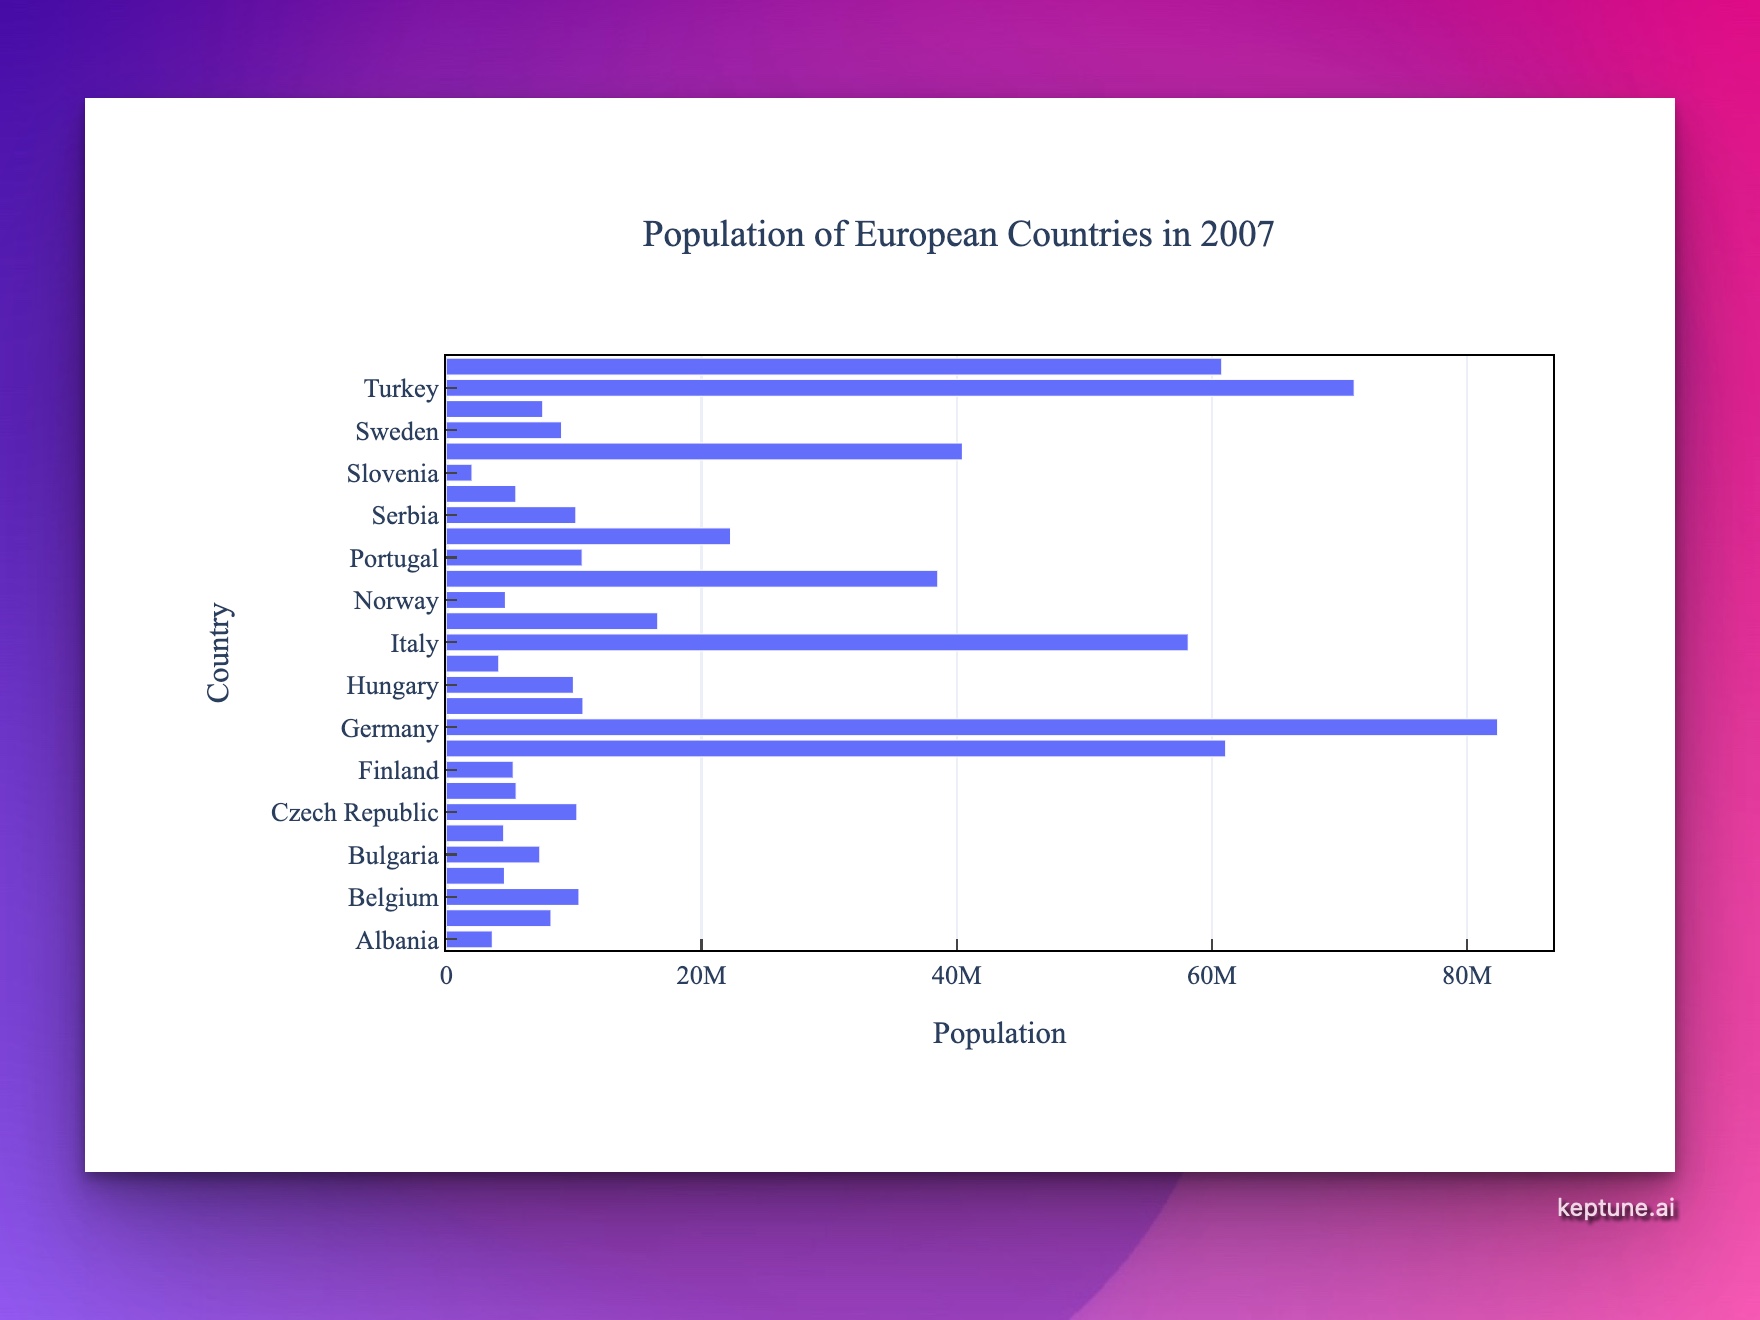
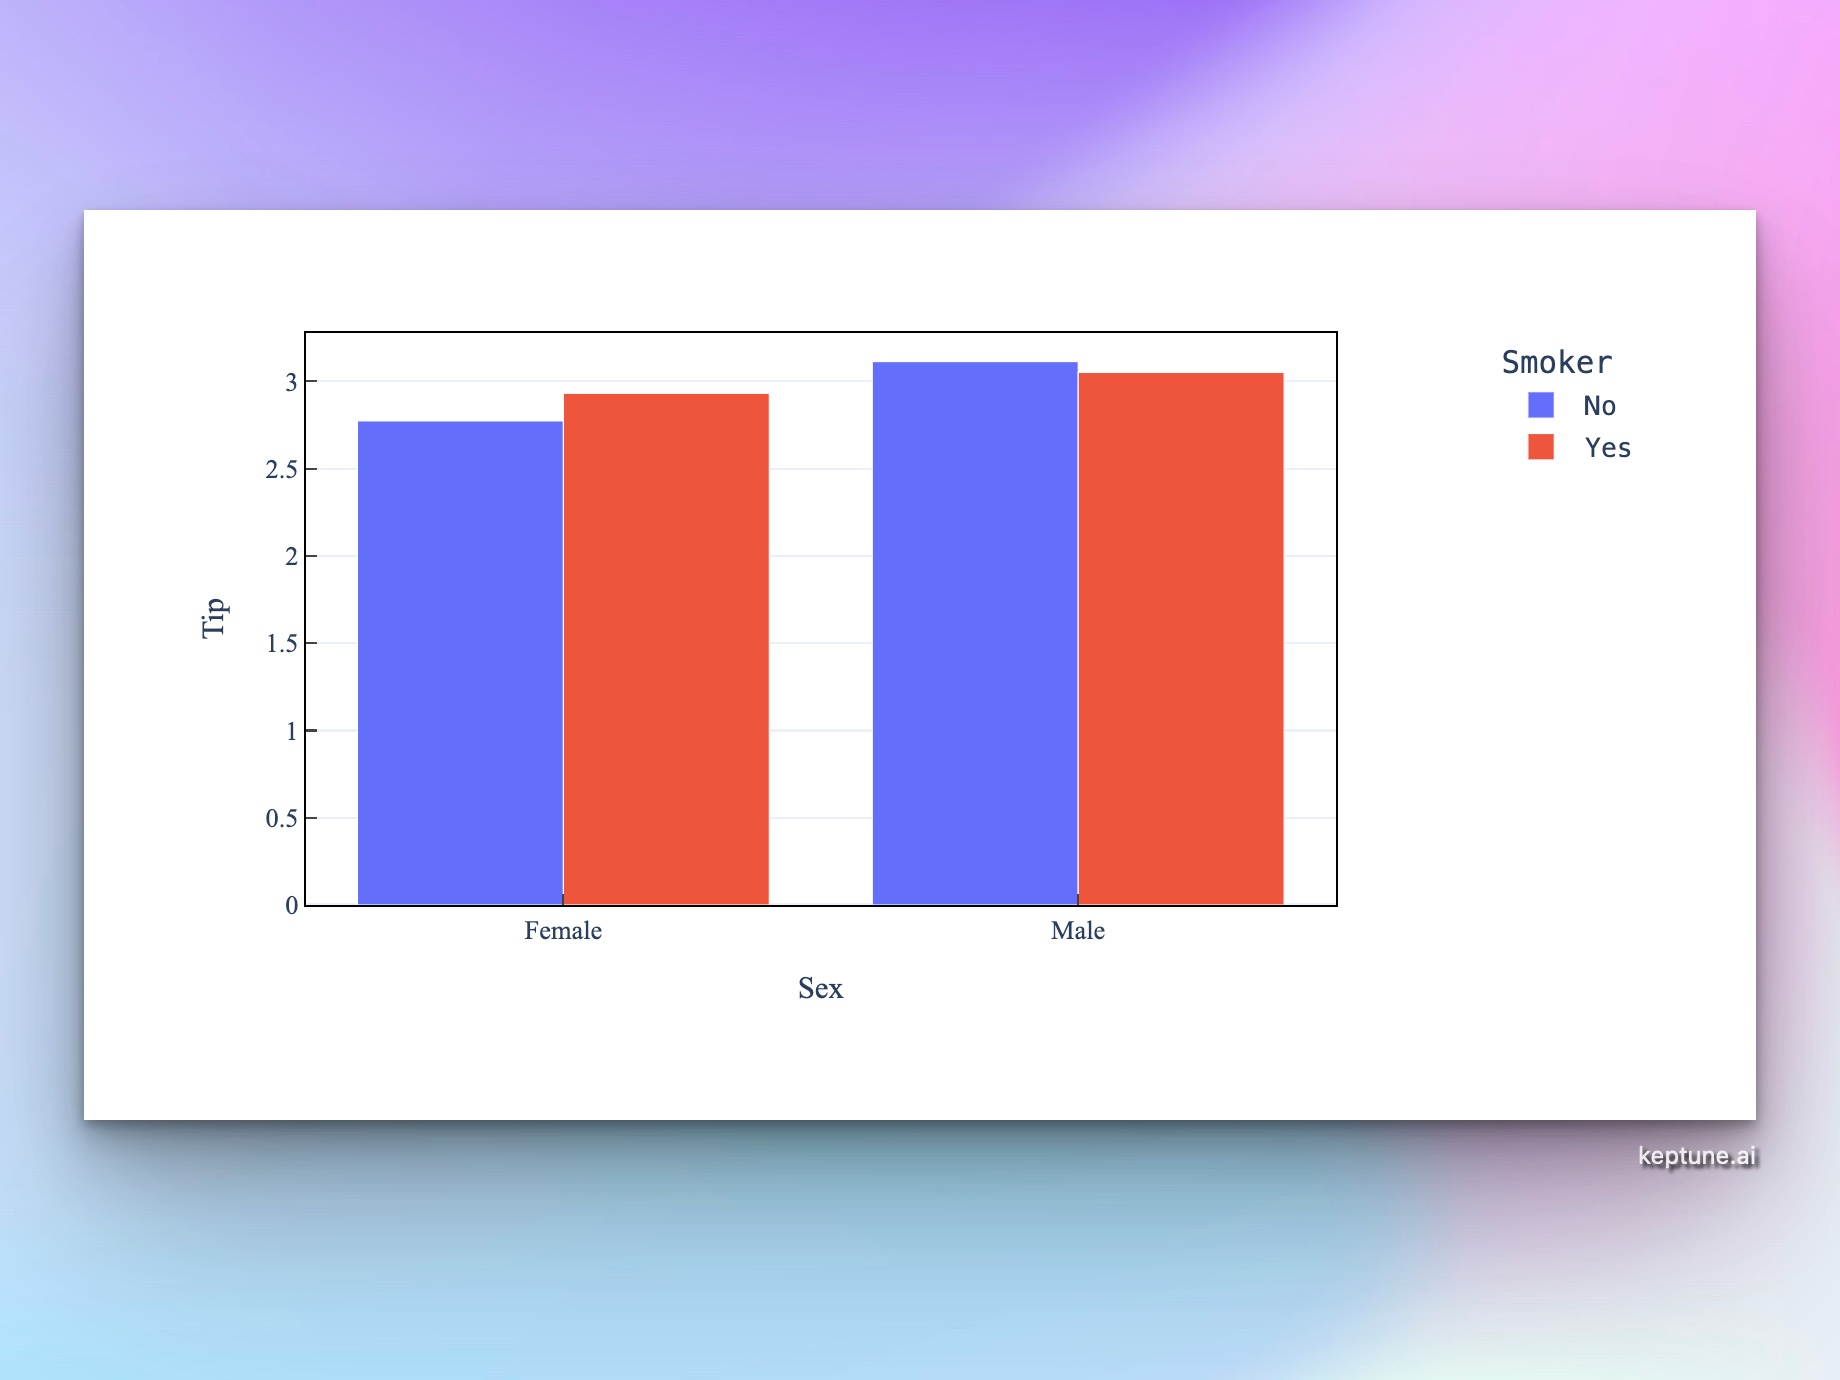
- Bar charts — compare categories side by side or stacked
- Histograms — understand distributions
- Pie and donut charts — show proportions at a glance
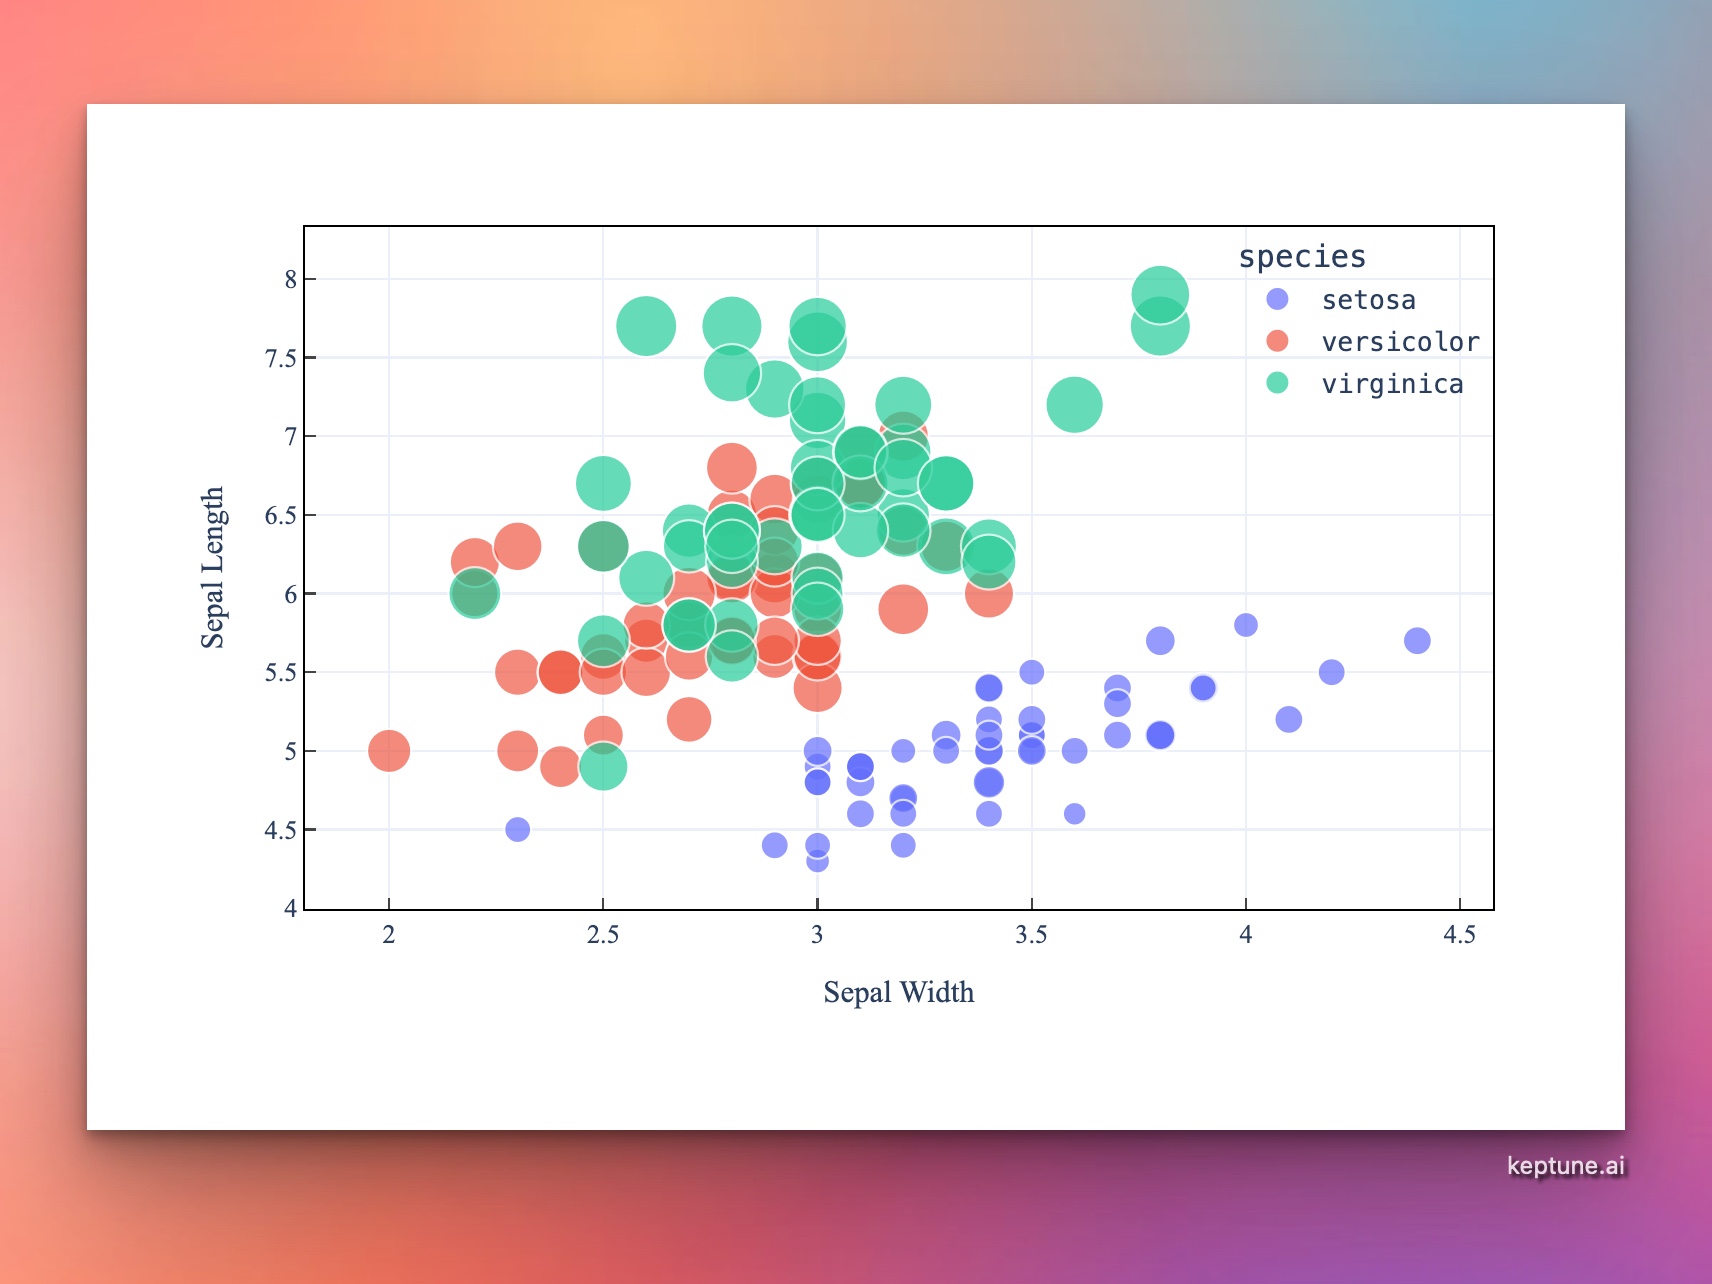
- Bubble charts — encode a third variable through point size
You can also ask for advanced customizations: log scales, trendlines, color themes, facet grids, annotations, and more.
Example Prompts
| What you want | What to type |
|---|---|
| Sales over time | line chart of monthly_sales over date, grouped by product_category |
| Group comparison | bar chart comparing average score by department |
| Correlation | scatter plot of height vs weight colored by gender |
| Distribution | histogram of age with 20 bins |
| Market share | pie chart of revenue by region |
Who Uses This Tool
Analysts and data scientists use Keptune to quickly prototype charts before building dashboards. Students and researchers use it to visualize datasets for papers and presentations. Business users use it to turn spreadsheet exports into shareable charts without needing Excel or Tableau.
Frequently Asked Questions
What file formats are supported? CSV, XLSX, and XLS. If your data is in Google Sheets, export it as CSV first.
Do I need to know Python or Plotly? No. Describe what you want in plain English and the AI writes the code for you. You can also edit the generated code directly in the notebook if you want to customize further.
Can I upload multiple files? Yes — upload multiple files and reference them in your prompt, e.g. "join sales.csv and targets.csv on month, then plot actuals vs. targets".
How do I download the chart? Hover over the chart and click the camera icon in the top-right corner to download a PNG. You can also ask the AI to adjust the size or resolution.
What's the difference between this and the bar/line/scatter chart tools? This general chart generator handles any chart type. The specific tools (bar, line, scatter, etc.) are pre-configured for that chart type and have simpler prompts — useful if you already know what kind of chart you want.