Exploratory Data Analysis Tool for Excel & CSV
Run exploratory data analysis online from Excel and CSV files. Profile columns, missing values, outliers, distributions, and correlations with AI.
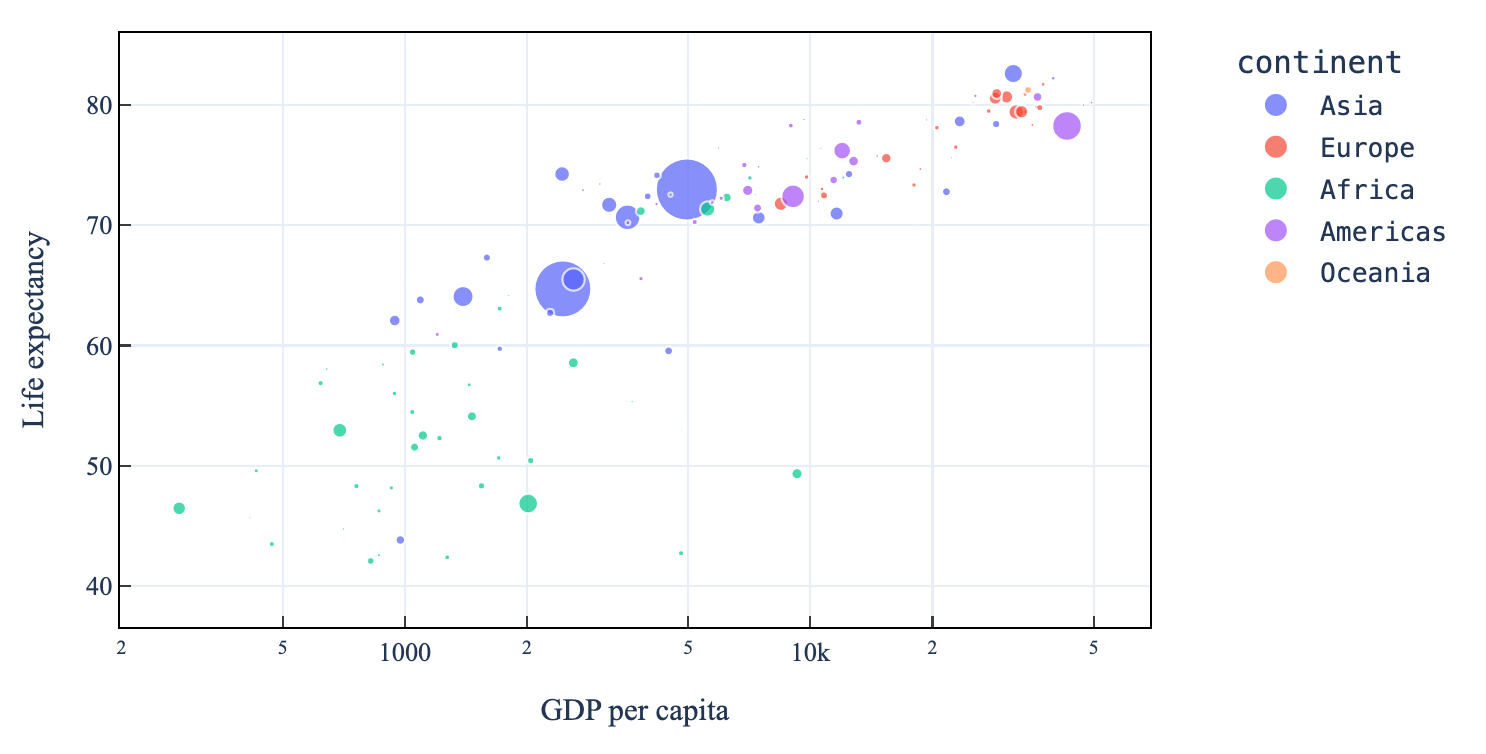
Or try with a sample dataset:
Preview
What Is Exploratory Data Analysis?
Exploratory Data Analysis (EDA) is the process of summarizing, visualizing, and understanding a dataset before building models or drawing conclusions. It reveals the shape of your data — its distributions, outliers, correlations, and anomalies — so you know what you're working with.
Upload any CSV or Excel file and describe what you want to explore. The AI will generate code to analyze your data and produce charts, summary tables, and insights.
What Gets Analyzed
A full EDA typically covers:
- Data overview — number of rows, columns, data types, memory usage
- Missing values — which columns have nulls, and how many
- Descriptive statistics — mean, median, std, min/max, quartiles for numeric columns
- Distributions — histograms and box plots for each numeric variable
- Correlations — heatmap showing relationships between numeric columns
- Categorical summaries — value counts and frequency charts for categorical columns
- Outlier detection — identifying unusual values using IQR or z-scores
How It Works
- Upload your data — CSV, XLSX, or XLS
- Describe your focus — leave it general for a full overview, or focus on specific columns or questions
- Get charts and tables — interactive visualizations with explanations for each finding
Example Prompts
| What you want | What to type |
|---|---|
| Full overview | perform EDA on this dataset |
| Focus on target variable | EDA focusing on the churn column and what features correlate with it |
| Missing data | analyze missing values and suggest how to handle them |
| Outlier detection | find outliers in the numeric columns and visualize them |
| Relationships | explore correlations between all numeric variables |
Frequently Asked Questions
How large a file can I upload? Files up to 50 MB are supported. For very large files, consider uploading a representative sample first to explore the structure.
Does it automatically generate charts? Yes — the AI produces histograms, box plots, correlation heatmaps, and bar charts as part of the analysis. You can ask for additional specific charts in follow-up prompts.
Can I ask follow-up questions? Yes — after the initial EDA, continue in the same chat session. For example: "now run a t-test comparing group A and group B on the salary column".
What if my data needs cleaning first? Describe the issue and the AI will handle it — e.g. "the price column has some entries with currency symbols, clean those before analyzing".