Pivot Table Generator for Excel & CSV
Create pivot tables online from Excel and CSV data. Group, summarize, count, and aggregate rows with AI-generated analysis.
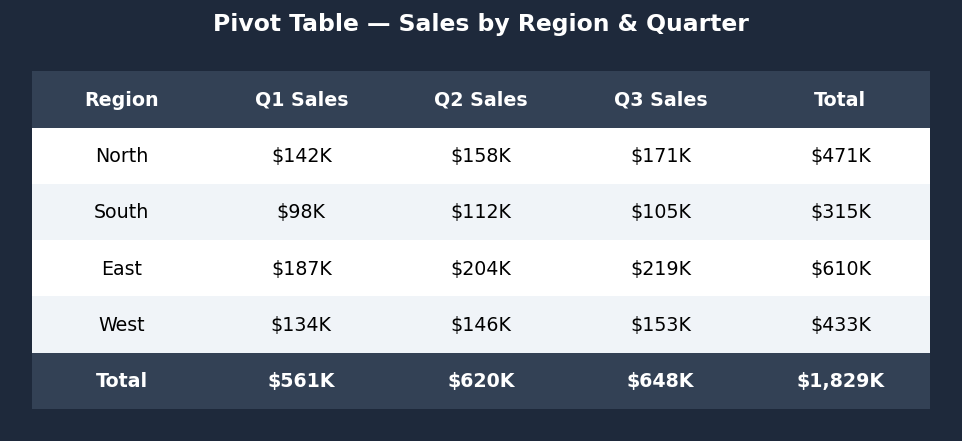
Or try with a sample dataset:
Preview
What Is a Pivot Table?
A pivot table summarizes a large dataset by grouping rows by one or more categories and aggregating a numeric column — summing, counting, averaging, or finding min/max values. It is one of the most powerful data analysis tools for quickly extracting insights from raw data.
Use a pivot table when you want to:
- Sum sales by region and product category
- Count the number of orders per customer per month
- Calculate the average score by department and year
- Find the maximum or minimum value within each group
How It Works
- Upload your data — CSV or Excel file
- Describe the table — e.g. "pivot table showing total revenue by region and product category"
- Get a formatted table — rows are the grouping categories, columns are the aggregated values
Common Aggregations
| Aggregation | What it computes |
|---|---|
| Sum | Total of numeric values in each group |
| Count | Number of rows in each group |
| Mean / Average | Average value in each group |
| Min / Max | Smallest or largest value in each group |
| Median | Middle value in each group |
| % of total | Each group's share of the grand total |
Example Prompts
| What you want | What to type |
|---|---|
| Sales by region | pivot table: sum of revenue grouped by region |
| Two-level grouping | pivot table of total sales by region and product_category |
| Count instead of sum | count of orders by customer_id and month |
| Average salary | average salary by department and job_level |
| Multiple aggregations | pivot table showing sum and count of revenue by region |
| Percentage of total | pivot table of revenue by category as percentage of total |
Frequently Asked Questions
Can I group by multiple columns at once? Yes — ask for "pivot table of revenue by region and product category" and the AI will create a multi-level grouped table.
Can I pivot wide instead of long? Yes — ask to "pivot so each product category becomes its own column" for a cross-tab layout (rows = regions, columns = categories, values = revenue).
How do I sort the results? Ask to "sort by total revenue descending" or "sort alphabetically by region".
Can I filter to only certain rows before pivoting? Yes — describe the filter in your prompt: "pivot table of revenue by region, only for orders in 2024".
What if I want to visualize the pivot table as a chart? After generating the pivot table, ask the AI to "visualize this as a grouped bar chart" in the same chat session.