One-Way ANOVA Calculator for Excel & CSV
Run one-way ANOVA online from Excel or CSV data. Compare group means, inspect post-hoc tests, and interpret effect sizes with AI.
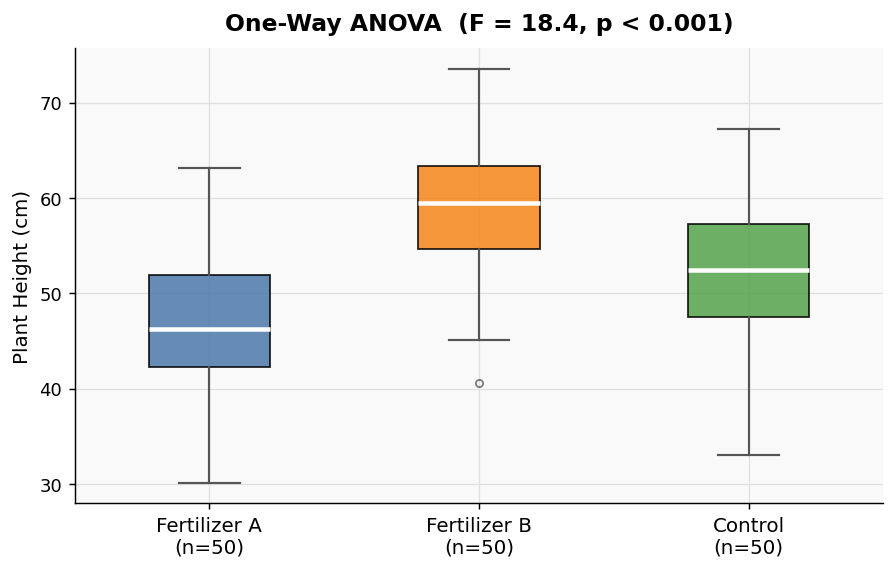
Or try with a sample dataset:
Preview
What Is One-Way ANOVA?
One-way ANOVA (Analysis of Variance) tests whether the means of three or more groups are significantly different from each other. It extends the two-sample t-test to multiple groups while controlling the false-positive rate.
Use one-way ANOVA when you have:
- One categorical independent variable (the grouping factor) with 3+ levels
- One continuous dependent variable (the measurement)
- Independent observations across groups
Example: Does average exam score differ across three teaching methods (lecture, online, hybrid)?
How It Works
- Upload your data — CSV or Excel file with a column for group labels and a column for measurements
- Describe your columns — e.g. "compare mean yield across the three fertilizer groups in the treatment column"
- Get full results — F-statistic, p-value, group means, and a post-hoc test if significant
The AI identifies your columns automatically and generates Python code using SciPy and Pingouin.
Interpreting the Results
| Output | What it means |
|---|---|
| F-statistic | Ratio of between-group variance to within-group variance; higher = more separation |
| p-value | Probability of seeing these differences by chance; p < 0.05 is conventionally significant |
| Group means | Mean of the dependent variable for each group |
| Post-hoc test (Tukey HSD) | Which specific pairs of groups differ, shown when p < 0.05 |
Example Prompts
| Scenario | What to type |
|---|---|
| Compare test scores | one-way ANOVA: dependent variable is score, groups are defined by teaching_method |
| Crop yield experiment | compare yield across fertilizer groups (fertilizer column, yield column) |
| Customer satisfaction | ANOVA on satisfaction_score grouped by region |
Assumptions to Check
One-way ANOVA assumes:
- Normality — residuals are approximately normally distributed (use Shapiro-Wilk for small samples)
- Homogeneity of variance — groups have similar variance (Levene's test is run automatically)
- Independence — observations are not paired or repeated
If Levene's test is significant (p < 0.05), ask the AI to run Welch's ANOVA instead, which is robust to unequal variances.
Frequently Asked Questions
What's the difference between one-way and two-way ANOVA? One-way ANOVA has a single grouping factor. Two-way ANOVA has two factors and can detect interaction effects between them. Use the two-way ANOVA calculator if you have two independent variables.
What if my p-value is significant — which groups are different? A significant ANOVA only tells you some groups differ. The Tukey HSD post-hoc test (included automatically) shows exactly which pairs are different.
My data isn't normally distributed — can I still use ANOVA? ANOVA is fairly robust to mild non-normality, especially with larger samples (n > 30 per group). For small samples with clear non-normality, ask the AI to run a Kruskal-Wallis test instead.
How do I format my data?
Your file should have one row per observation, a column with group labels (e.g. "control", "treatment_A", "treatment_B"), and a column with the numeric measurement. Wide-format data (one column per group) is also supported — just describe it.