Multiple Regression Calculator for Excel & CSV
Run multiple regression online from Excel or CSV data. Model one outcome with multiple predictors, interpret coefficients, and compare fit with AI.
Or try with a sample dataset:
Preview
What Is Multiple Regression?
Multiple regression extends simple linear regression to model the effect of two or more predictor variables on a continuous outcome simultaneously. It answers: controlling for all other predictors, how much does each one individually affect the outcome?
Use multiple regression when:
- You have several variables that may each influence an outcome
- You want to control for confounders (e.g. holding age constant while measuring the effect of income)
- You need more accurate predictions than a single predictor provides
For a single predictor, use Linear Regression.
How It Works
- Upload your data — CSV or Excel with predictor columns and an outcome column
- Describe the model — e.g. "predict house_price using square_footage, bedrooms, and location_score"
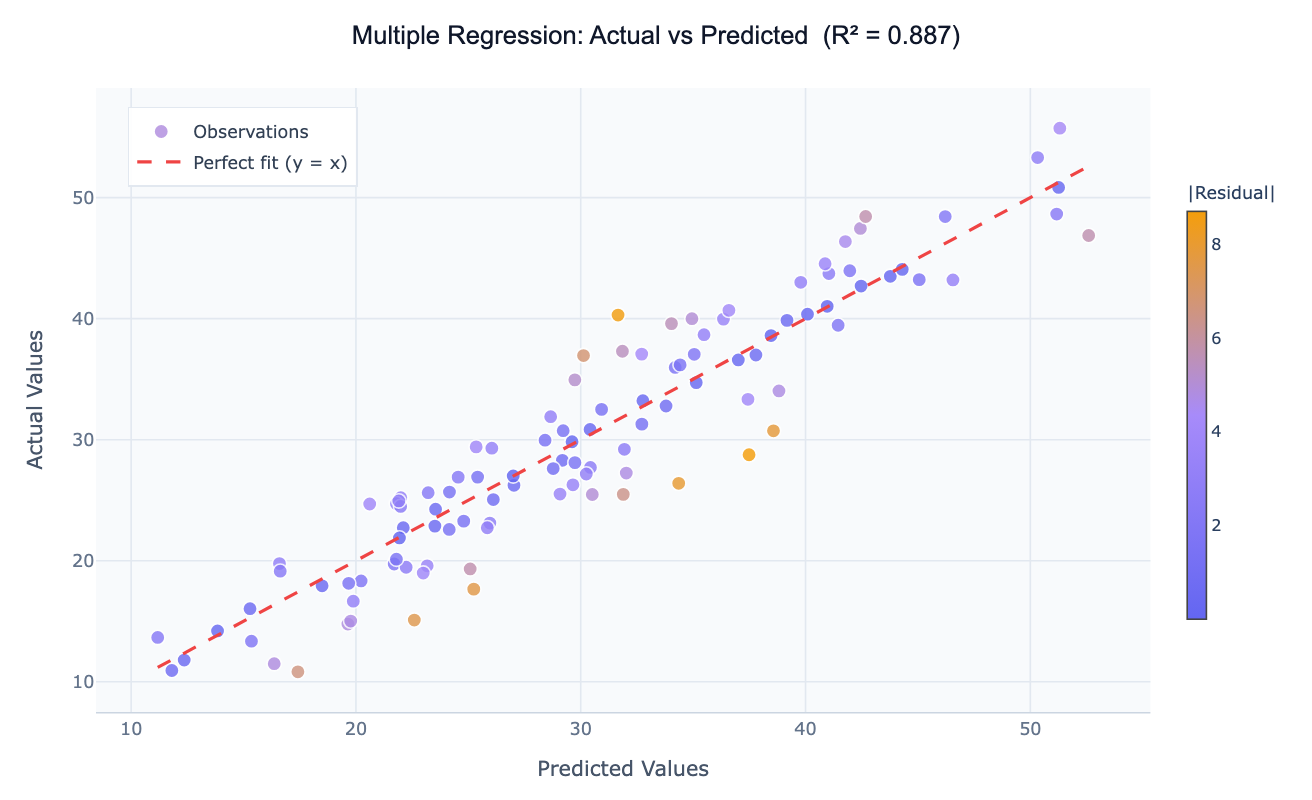
- Get full results — coefficients, p-values, R², adjusted R², and diagnostic plots
The AI generates Python code using statsmodels or scikit-learn.
Interpreting the Results
| Output | What it means |
|---|---|
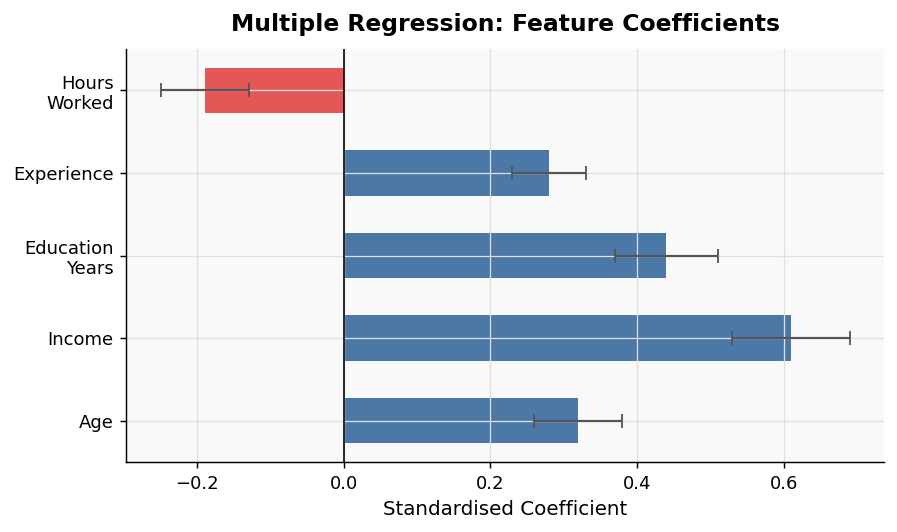
| Coefficient | Change in outcome for a one-unit increase in that predictor, holding all others constant |
| p-value | Whether that predictor's effect is statistically significant |
| R² (R-squared) | Proportion of outcome variance explained by all predictors combined |
| Adjusted R² | R² penalized for the number of predictors — use this to compare models with different numbers of variables |
| VIF | Variance Inflation Factor — flags multicollinearity between predictors (VIF > 5–10 is a concern) |
Example Prompts
| Scenario | What to type |
|---|---|
| Real estate pricing | multiple regression: predict price using size, bedrooms, bathrooms, and age |
| Employee performance | regression of performance_score on experience, training_hours, and manager_rating |
| Marketing attribution | predict conversions using email_opens, ad_clicks, and page_views |
| Health outcomes | multiple regression of blood_pressure on age, bmi, and exercise_frequency |
Assumptions to Check
- Linearity — each predictor has a linear relationship with the outcome
- No multicollinearity — predictors should not be highly correlated with each other (check VIF)
- Homoscedasticity — residual variance is constant across fitted values
- Normality of residuals — residuals follow an approximately normal distribution
- Independence — observations are not repeated measures or time series (use specialized models for those)
Frequently Asked Questions
How many predictors can I include? As a rule of thumb, you need at least 10–20 observations per predictor to avoid overfitting. With 200 rows, 10–20 predictors is reasonable.
Two of my predictors are highly correlated — is that a problem? Yes — this is called multicollinearity, and it inflates standard errors, making coefficients unreliable. The AI will flag high VIF values automatically. You may need to drop one of the correlated variables or combine them.
How do I compare two different models? Ask the AI to fit both models and compare their adjusted R² and AIC values. A lower AIC indicates a better fit relative to model complexity.
What if my outcome is binary? Use Logistic Regression instead.