Linear Regression Calculator for Excel & CSV
Run linear regression online from Excel or CSV data. Estimate slopes, confidence intervals, R-squared, and fitted trendlines with AI.
Or try with a sample dataset:
Preview
What Is Linear Regression?
Linear regression models the relationship between one predictor variable and a continuous outcome, fitting a straight line that best describes how the outcome changes as the predictor changes.
Use linear regression when you want to:
- Quantify how much one variable affects another (e.g. how much does advertising spend increase sales?)
- Predict an outcome for new values of the predictor
- Test whether a relationship is statistically significant
For multiple predictor variables, use Multiple Regression.
How It Works
- Upload your data — CSV or Excel with a predictor column and an outcome column
- Describe the relationship — e.g. "linear regression predicting house_price from square_footage"
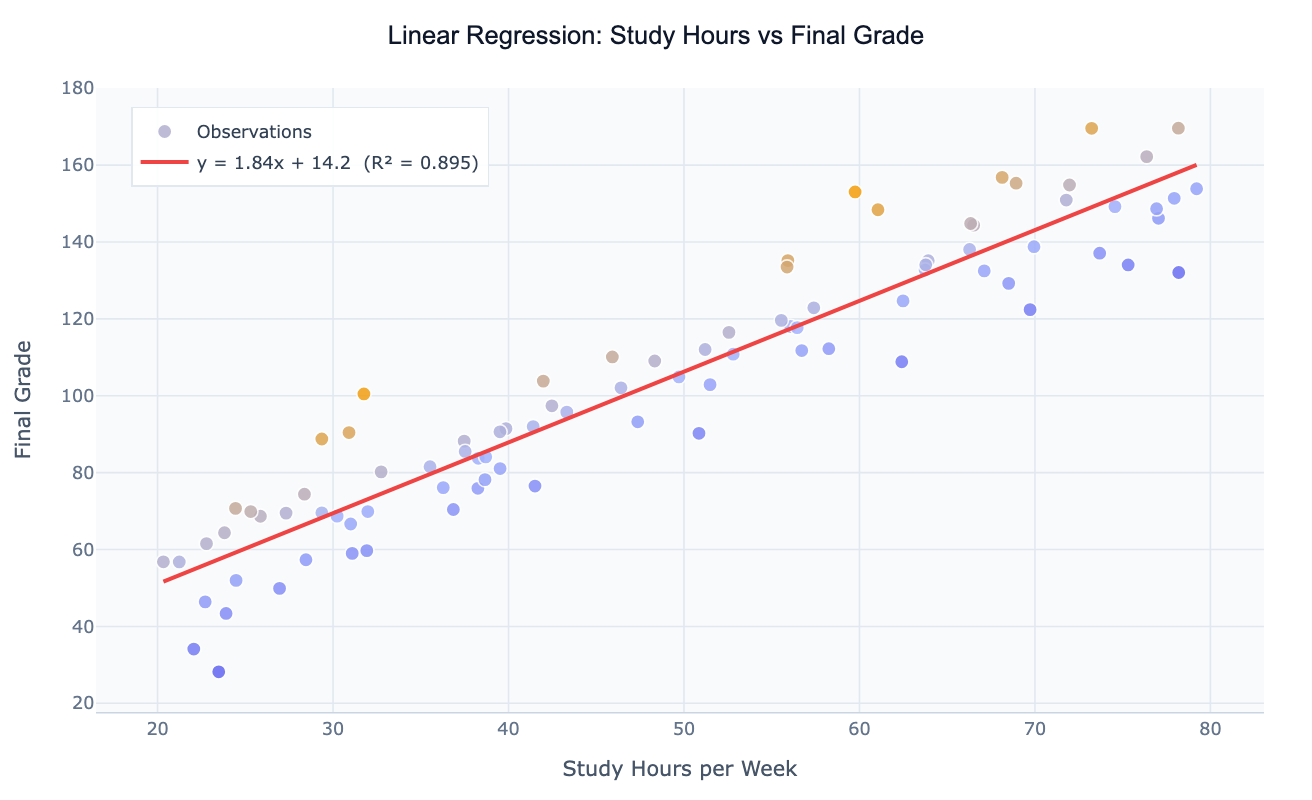
- Get full results — regression equation, R², slope, intercept, p-values, and a scatter plot with the fitted line
The AI generates Python code using scikit-learn and statsmodels.
Interpreting the Results
| Output | What it means |
|---|---|
| Slope (coefficient) | Change in the outcome for a one-unit increase in the predictor |
| Intercept | Predicted outcome when the predictor equals zero |
| R² (R-squared) | Proportion of variance in the outcome explained by the model (0–1; higher is better) |
| p-value | Whether the relationship is statistically significant (p < 0.05 is conventional) |
| Confidence interval | Range that likely contains the true slope |
Example Prompts
| Scenario | What to type |
|---|---|
| Sales prediction | linear regression: predict revenue from advertising_spend |
| Real estate | regression of house_price on square_footage |
| Biology | linear regression between plant height and fertilizer amount |
| Education | predict exam_score from hours_studied |
Assumptions to Check
- Linearity — the relationship between X and Y is approximately linear (check scatter plot)
- Homoscedasticity — residuals have constant variance across all fitted values
- Normality of residuals — residuals are approximately normally distributed
- No influential outliers — a few extreme points can distort the line significantly
Ask the AI to generate residual plots to check these automatically.
Frequently Asked Questions
What's the difference between linear regression and correlation? Correlation measures the strength and direction of a relationship. Linear regression quantifies the exact slope and lets you make predictions. They are related but answer different questions.
My R² is low — does that mean the model is useless? Not necessarily. A low R² means the predictor explains only a small portion of the variance, but the relationship can still be real and statistically significant. Consider adding more predictors using Multiple Regression.
How do I make predictions for new values? After fitting the model, ask the AI: "predict house_price for square_footage = 1500".
What if my outcome variable is binary (yes/no)? Linear regression is not suitable for binary outcomes. Use Logistic Regression instead.