Logistic Regression Calculator for Excel & CSV
Run logistic regression online from Excel or CSV data. Estimate odds ratios, predicted probabilities, ROC curves, and classification metrics with AI.
Or try with a sample dataset:
Preview
What Is Logistic Regression?
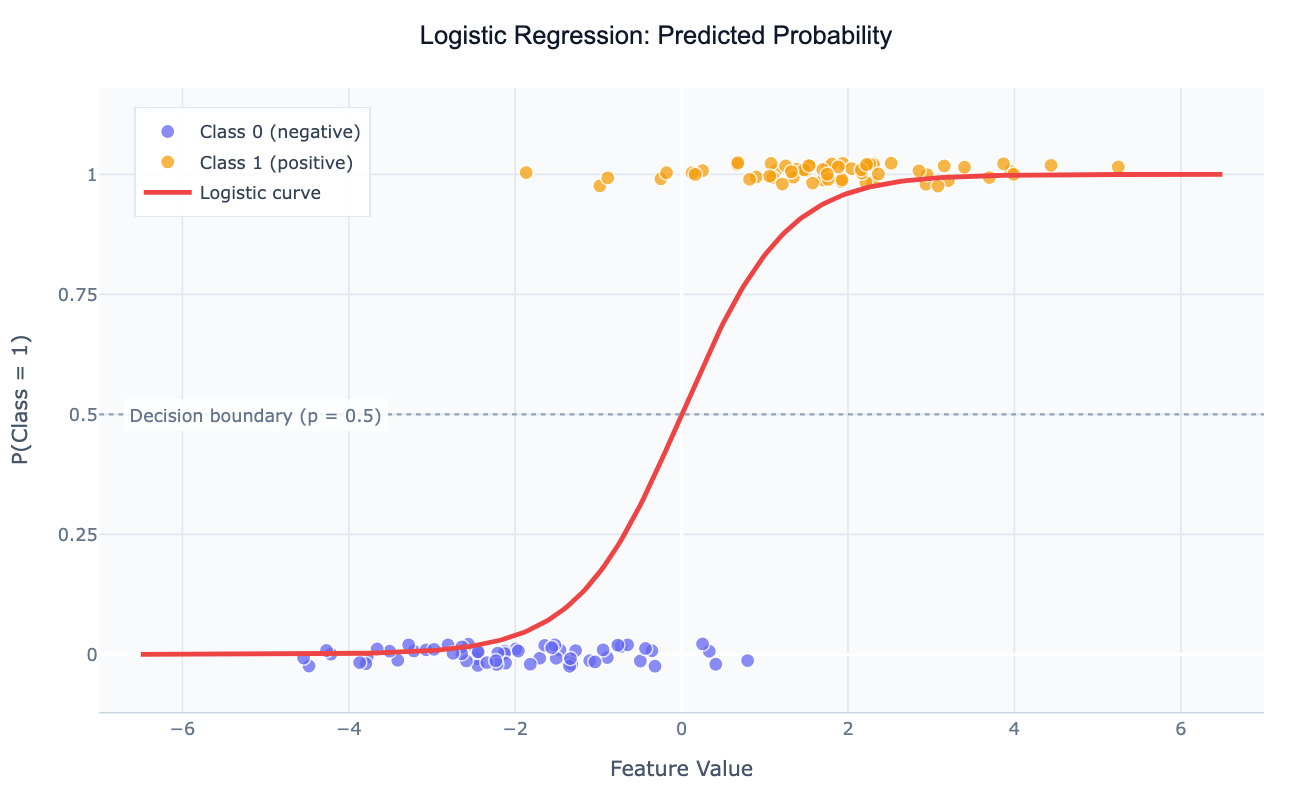
Logistic regression predicts the probability of a binary outcome — yes/no, pass/fail, churned/retained, diseased/healthy. Despite the name, it is a classification method, not a regression in the traditional sense.
Use logistic regression when:
- Your outcome variable has exactly two categories (0/1, True/False)
- You want to understand which predictors increase or decrease the probability of the outcome
- You need interpretable coefficients, not just a black-box prediction
How It Works
- Upload your data — CSV or Excel with predictor columns and a binary outcome column
- Describe the model — e.g. "logistic regression predicting churn (0/1) using tenure, monthly_charges, and contract_type"
- Get full results — coefficients, odds ratios, p-values, confusion matrix, and ROC curve
The AI generates Python code using scikit-learn and statsmodels.
Interpreting the Results
| Output | What it means |
|---|---|
| Coefficient | Direction of each predictor's effect on the log-odds of the outcome |
| Odds ratio (exp(coef)) | Multiplicative change in odds for a one-unit increase in the predictor; OR > 1 increases odds, OR < 1 decreases odds |
| p-value | Statistical significance of each predictor |
| Accuracy | Percentage of correctly classified observations |
| AUC (ROC curve) | Overall discriminative ability of the model; 0.5 = random, 1.0 = perfect |
| Confusion matrix | Breakdown of true positives, false positives, true negatives, false negatives |
Example Prompts
| Scenario | What to type |
|---|---|
| Customer churn | logistic regression: predict churn using tenure, monthly_charges, and contract_type |
| Loan default | predict default (0/1) from credit_score, income, and loan_amount |
| Medical diagnosis | logistic regression of disease_present on age, bmi, and blood_pressure |
| Pass/fail prediction | predict exam_pass using hours_studied and attendance_rate |
Logistic vs. Linear Regression
| Linear Regression | Logistic Regression | |
|---|---|---|
| Outcome type | Continuous (e.g. price, score) | Binary (e.g. yes/no, 0/1) |
| Output | Predicted value | Predicted probability (0–1) |
| Evaluation metric | R², RMSE | Accuracy, AUC, F1-score |
Frequently Asked Questions
Do I need to scale my predictor variables? Scaling is not required for interpretation, but it helps convergence and makes coefficients comparable. Ask the AI to "standardize predictors before fitting" if you want normalized coefficients.
My outcome is imbalanced — 95% are 0, 5% are 1. What should I do? Class imbalance inflates accuracy but hurts recall on the minority class. Ask the AI to "use class weighting to handle imbalanced classes" and evaluate using AUC or F1-score instead of accuracy.
What if I have more than two outcome categories? Use multinomial logistic regression. Ask the AI to "run multinomial logistic regression predicting category using predictors A, B, C".
How do I make predictions for new data? After fitting, ask: "predict the probability of churn for tenure=12, monthly_charges=65, contract_type=Month-to-month".