Flow Diagram Generator for Excel & CSV
Create flow diagrams online from Excel and CSV data. Map processes, pathways, and step-by-step structures with AI.
Preview
What Is a Flow Diagram?
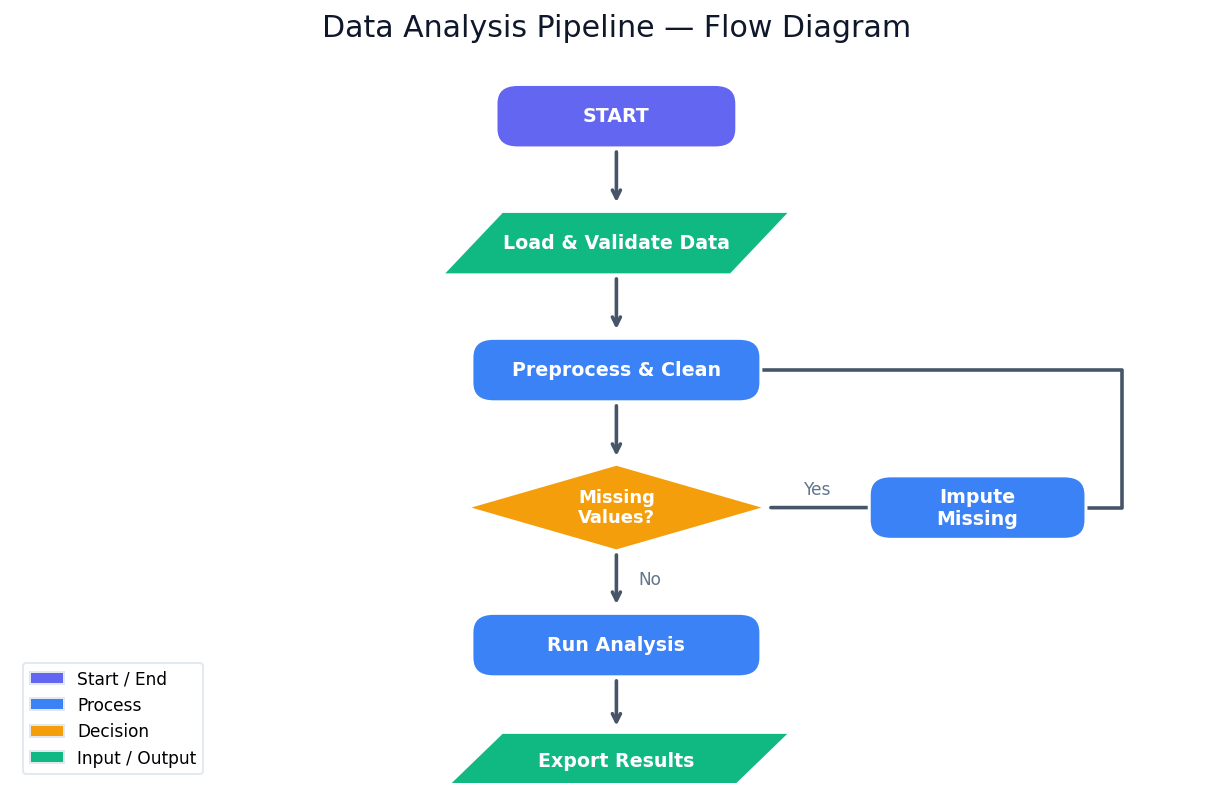
A flow diagram (or flowchart) is a visual representation of a process, workflow, or algorithm using standardized symbols connected by arrows that show the direction of flow. Each symbol encodes the type of step: rounded rectangles mark the start and end of a process, plain rectangles represent processing steps (actions, transformations, calculations), diamonds indicate decision points (yes/no branches, condition checks), and parallelograms denote input/output (data read, results written). Arrows between shapes show the sequence and any loops or branches.
Flow diagrams are used in virtually every domain that involves multi-step processes: software engineering (algorithm design, system architecture, data pipeline documentation), business operations (onboarding workflows, approval chains, customer journey maps), science and medicine (clinical trial protocols, experimental procedures, patient care pathways), and education (explaining how an algorithm or biological process works step by step). A well-drawn flowchart makes a complex process instantly understandable to someone who has never seen it before — it replaces paragraphs of prose with a visual structure that can be scanned in seconds.
The key to a useful flow diagram is the right level of abstraction. Too granular and it becomes an unreadable wall of boxes; too coarse and it loses the detail that makes it actionable. Describe your process in plain language, specifying which steps involve decisions and what the branches lead to, and the AI will choose the appropriate symbol for each step and lay out the diagram to minimize crossing arrows.
How It Works
- Describe your process — explain the steps, decisions, and flow in plain language. You don't need to know the diagram syntax — just describe what happens.
- Specify the style — e.g. "color decision diamonds yellow, use blue for process steps, horizontal layout"
- Get the diagram — the AI writes Python code using matplotlib with custom shape drawing or Graphviz via the
graphvizpackage to render the flowchart as a PNG or SVG
Interpreting the Results
| Shape | What it represents |
|---|---|
| Rounded rectangle (pill shape) | Start or end — the entry and exit points of the process |
| Rectangle | Process step — an action, calculation, or transformation |
| Diamond | Decision — a yes/no or condition branch |
| Parallelogram | Input or output — data being read in or results being written out |
| Arrow | Flow direction — sequence from one step to the next |
| Loop (arrow going backward) | Iteration — a step that repeats until a condition is met |
| Label on an arrow | Condition — which branch is taken (Yes/No, Pass/Fail) |
Example Prompts
| Scenario | What to type |
|---|---|
| Data pipeline | flow diagram of a data pipeline: load CSV → validate → clean missing values → normalize → train model → evaluate → save |
| Decision tree | flowchart for loan approval: check credit score, if < 600 reject, else check income, if sufficient approve, else request collateral |
| Algorithm | flow diagram of binary search algorithm with loop and mid-point comparison |
| Business process | flowchart for customer support ticket: received → assign priority → if urgent escalate to senior, else resolve → close ticket |
| Clinical protocol | flow diagram of clinical trial screening: consent → eligibility check → if excluded note reason, if eligible randomize → treatment or control |
Frequently Asked Questions
Do I need to know any diagram syntax or code? No — describe the process in plain English. The AI interprets your description and maps each step to the correct symbol. If you want explicit control, you can mention symbols directly: "use a diamond for the approval check" or "parallelogram for the output step".
Can I get a horizontal layout instead of top-to-bottom? Yes — ask for "horizontal layout, left to right". You can also ask for "swimlane layout" to separate steps by role or department into parallel lanes.
How do I show a loop or repeated step? Describe the repetition: "loop back to the validation step if errors are found". The AI will draw a backward arrow from the failure branch back to the appropriate earlier step.
Can I get the diagram as an SVG instead of a PNG? Yes — ask for "save as SVG". SVG is vector format and scales without losing quality, making it ideal for documents and presentations. You can also ask for "editable code" to get the Graphviz DOT source or matplotlib code to modify the layout yourself.
What's the difference between a flow diagram and a network graph? A flow diagram shows sequential steps in a directed process — there is a clear start, a defined order, and an end. A network graph shows relationships between entities without necessarily implying a sequence or direction — for example, connections between people in a social network or links between web pages. Use a flow diagram for processes and algorithms; use the AI Network Graph Generator for entity relationships.