Cox Proportional Hazards Calculator
Fit Cox proportional hazards models online from Excel or CSV survival data. Estimate hazard ratios, test assumptions, and compare risk with AI.
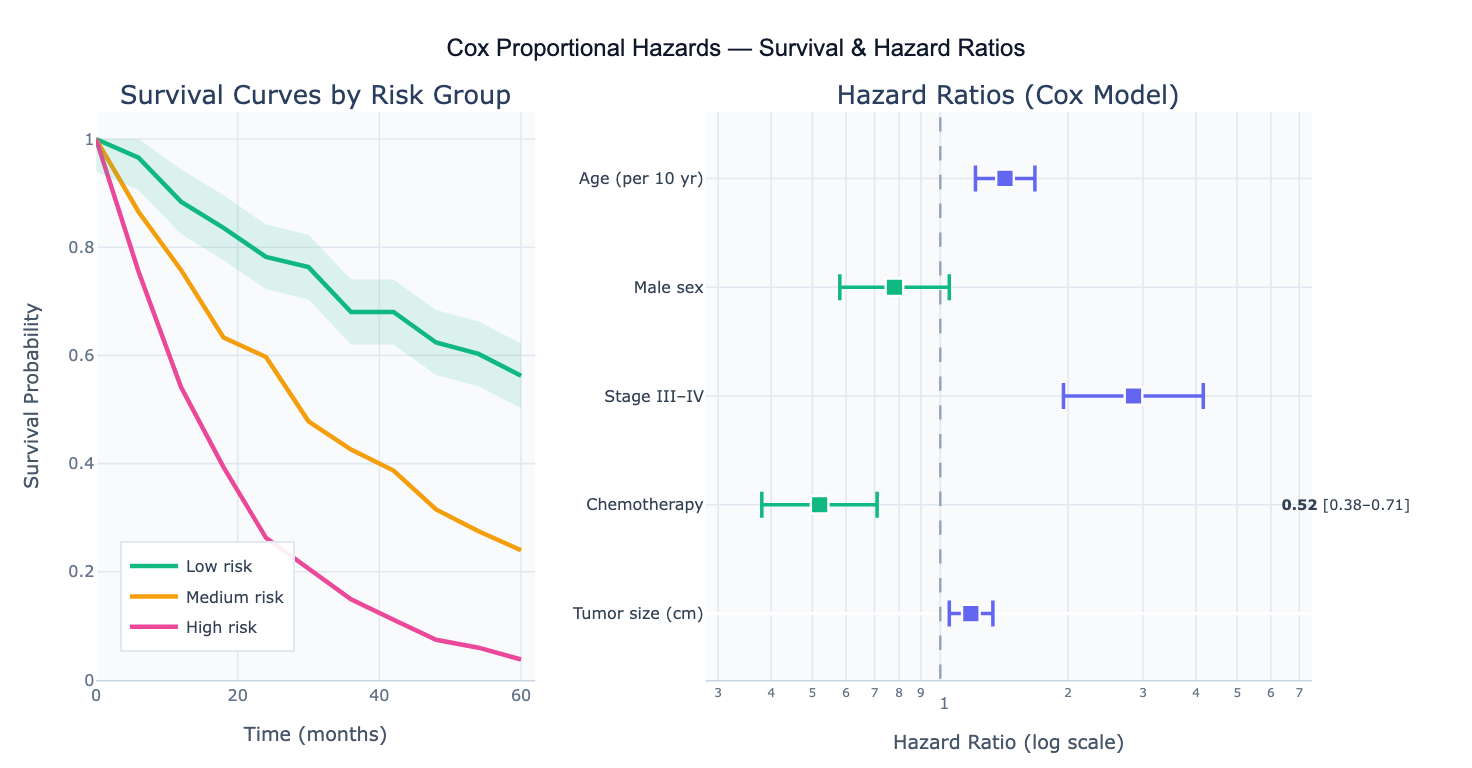
Preview
What Is the Cox Proportional Hazards Model?
The Cox proportional hazards (Cox PH) model is the most widely used regression method for survival analysis — data where the outcome is the time until an event occurs (death, disease recurrence, equipment failure, customer churn). Unlike ordinary linear regression, survival data has two special features: the outcome is a time, and many subjects may not yet have experienced the event at the end of the study (censoring). The Cox model handles both by modeling the hazard function h(t) — the instantaneous rate of the event at time t — as a product of a baseline hazard h₀(t) and an exponential term depending on the covariates: h(t) = h₀(t) · exp(β₁X₁ + β₂X₂ + … + βₚXₚ). The key insight is that the baseline hazard cancels out in the partial likelihood, so the hazard ratios (HR = exp(β)) can be estimated without specifying the shape of the baseline survival curve.
The hazard ratio is the central output: HR = 1.5 for a covariate means that at any time point, subjects with one unit higher covariate value have 1.5× the hazard (instantaneous risk) of the event compared to a reference. HR > 1 means higher covariate → higher risk; HR < 1 means higher covariate → lower risk (protective). A 95% confidence interval and p-value accompany each HR. The model's name comes from the proportional hazards assumption: the ratio of hazards between any two subjects is constant over time — the survival curves for different covariate values never cross. This assumption must be checked before interpreting results.
The Cox model is semi-parametric — it makes no assumption about the shape of h₀(t), only that the log-hazard is linear in the covariates. This flexibility makes it the default survival regression model across clinical trials, epidemiology, engineering reliability, and customer analytics. A concrete example: a clinical trial with 500 cancer patients records time-to-recurrence (months) and a censoring indicator (1=recurred, 0=censored). The Cox model simultaneously adjusts for age, tumor stage, treatment arm, and sex, producing a hazard ratio for treatment that controls for the other covariates — equivalent to a multivariable-adjusted survival comparison.
How It Works
- Upload your data — provide a CSV or Excel file with a time column (time to event or censoring), an event column (1 = event occurred, 0 = censored), and one or more covariate columns (numeric or categorical). One row per subject.
- Describe the analysis — e.g. "fit Cox model with age, sex, and treatment as covariates; report HR and 95% CI; plot Kaplan-Meier curves by treatment group; test proportional hazards assumption with Schoenfeld residuals"
- Get full results — the AI writes Python code using lifelines CoxPHFitter and Plotly to fit the model, produce a forest plot of hazard ratios, plot survival curves stratified by covariate, and test the proportional hazards assumption
Required Data Format
| Column | Description | Example |
|---|---|---|
time | Time to event or last follow-up | 12.5, 36.0, 8.2 (months or days) |
event | Event indicator | 1 (event), 0 (censored) |
age | Numeric covariate | 45, 62, 38 |
treatment | Categorical covariate | 0 (control), 1 (treatment) |
stage | Ordered categorical | 1, 2, 3, 4 |
Any column names work — describe them in your prompt. Categorical variables are automatically one-hot encoded by lifelines. For categorical variables with more than 2 levels, specify the reference category in your prompt.
Interpreting the Results
| Output | What it means |
|---|---|
| Hazard Ratio (HR) | Multiplicative effect on hazard per unit increase; HR > 1 = higher risk, HR < 1 = protective |
| 95% CI on HR | Uncertainty range — if it excludes 1.0, the covariate is significant at α = 0.05 |
| p-value | Wald test for β = 0; small p = strong evidence of an effect on survival |
| Concordance index (C) | Model discrimination — fraction of pairs correctly ranked; 0.5 = random, 1.0 = perfect |
| Log-likelihood ratio test | Overall model fit vs null model — p < 0.05 means at least one covariate matters |
| Schoenfeld residuals | Test of proportional hazards — a significant slope over time indicates PH violation |
| Partial Schoenfeld test | Per-covariate PH test — identifies which covariates violate the assumption |
| Forest plot | Visual summary of HRs and 95% CIs — points right of HR=1 are risk factors, left are protective |
| Adjusted survival curves | Predicted survival curves at representative covariate values; shows covariate effect on survival trajectory |
| Baseline hazard | Estimated cumulative baseline hazard from Breslow estimator — needed for absolute risk prediction |
Example Prompts
| Scenario | What to type |
|---|---|
| Basic model | fit Cox model with age, sex, and treatment; report hazard ratios and 95% CI; forest plot |
| Categorical covariate | Cox regression; stage (1–4) as categorical with stage 1 as reference; age and sex as covariates; plot adjusted survival by stage |
| PH assumption check | fit Cox model; test proportional hazards assumption with Schoenfeld residuals; plot scaled Schoenfeld residuals vs time for each covariate |
| Stratified model | stratified Cox model with hospital site as strata; report HRs for treatment and age adjusted for site |
| Survival prediction | fit Cox model; predict 1-year, 3-year, and 5-year survival probabilities for a 55-year-old female in the treatment arm |
| Model comparison | fit Cox model with all covariates; compare to reduced model without BMI using likelihood ratio test; report AIC for both |
| Time-varying effect | Cox model; test if treatment effect is constant over time; if PH violated, fit extended model with treatment × log(time) interaction |
| Forest plot | Cox model with 6 covariates; produce publication-ready forest plot with HR, 95% CI, and p-value for each; log scale x-axis |
Assumptions to Check
- Proportional hazards — the ratio of hazards between two subjects must be constant over time; test with Schoenfeld residuals (
lifelines.statistics.proportional_hazard_test) or plotlog(-log(S(t)))vslog(t)(parallel lines = PH holds); if violated, use stratified Cox or add time-covariate interactions - Linear log-hazard — the log-hazard must be a linear function of each continuous covariate; check with martingale residuals plotted against the covariate; non-linearity suggests using splines or categorization
- Independent censoring — censoring must be uninformative (unrelated to the subject's prognosis); if patients drop out because they are too sick, the censoring is informative and standard Cox estimates are biased
- No strong collinearity — highly correlated covariates inflate standard errors and make HRs unstable; check VIF or correlation matrix before fitting
- Sufficient events — a reliable Cox model requires at least 10–15 events per covariate; with fewer events, use penalized Cox regression or reduce the model
Related Tools
Use the Survival Curve Generator to plot Kaplan-Meier curves and run log-rank tests before fitting the Cox model — KM curves reveal whether the proportional hazards assumption is plausible. Use the Logistic Regression calculator if you have binary outcomes without time-to-event data. Use the Multiple Regression calculator for continuous outcomes (no censoring). Use the Residual Plot Generator to inspect martingale or deviance residuals from the Cox fit for outlier detection.
Frequently Asked Questions
What is the difference between the Cox model and Kaplan-Meier analysis?Kaplan-Meier is a non-parametric estimator of the survival function — it produces the survival curve for a single group or compares two groups with the log-rank test, but cannot adjust for other covariates. The Cox model is a multivariable regression that estimates the effect of each covariate on survival while adjusting for all others simultaneously, just as multiple regression extends a simple two-group t-test. In practice: start with KM curves to visualize the data and check the PH assumption visually, then fit the Cox model to get adjusted hazard ratios. The KM survival curves for each level of a categorical covariate should not cross — crossing curves are a strong visual indicator of PH violation.
What does "proportional hazards" actually mean? Two subjects with covariate values X₁ and X₂ have hazard functions h₁(t) = h₀(t)·exp(β·X₁) and h₂(t) = h₀(t)·exp(β·X₂). Their ratio is h₁(t)/h₂(t) = exp(β·(X₁−X₂)) — a constant that does not depend on time t. This means the hazard ratio between any two subjects is the same at month 1, month 12, and month 60. Practically, this means the treatment cannot be highly effective early but ineffective later (or vice versa) — the effect must be proportionally constant. When treatments have delayed effects (immunotherapy) or time-limited effects, the PH assumption often fails and alternative models (restricted mean survival time, accelerated failure time, or time-varying Cox) are needed.
How do I interpret a hazard ratio for a continuous variable? An HR of 1.42 for age (per 10 years) means that for every 10-year increase in age, the hazard of the event is 42% higher, holding all other covariates constant. This is a multiplicative effect — a 20-year increase in age multiplies the hazard by 1.42² = 2.02. If age is measured in years (not decades), the same HR would be 1.035 per year (since 1.035¹⁰ ≈ 1.41). Always check the units of your covariates — small HRs can reflect per-unit effects of a covariate measured in large units.
What is the concordance index and how good does it need to be? The concordance index (C-index) measures how well the model ranks subjects by their survival time — it is the probability that a randomly chosen subject who experienced the event earlier had a higher predicted hazard score. C = 0.5 is random (coin flip); C = 1.0 is perfect discrimination. In clinical oncology, C values of 0.65–0.75 are typical for a good prognostic model; values above 0.80 are exceptional. The C-index is analogous to the AUC-ROC for binary outcomes. A high C-index means the model reliably ranks patients from lowest to highest risk, which is useful for stratifying clinical trials or prioritizing high-risk patients for intervention.
How do I handle a covariate that violates proportional hazards? There are three main approaches: (1) Stratify — include the violating covariate as a stratification variable rather than a predictor; the model fits separate baseline hazards per stratum and removes the covariate from the HR table (useful for nuisance variables like study site); (2) Time-varying coefficient — add an interaction term between the covariate and log(time) or time itself to let the HR evolve over time; (3) Split time intervals — fit separate Cox models in each time interval where the PH assumption holds. Ask the AI to "test the proportional hazards assumption; if violated for treatment, add a treatment × log(time) interaction and re-fit the model".