Sales Pipeline Conversion Calculator
Analyze pipeline conversion online from Excel or CSV CRM data. Measure stage-to-stage rates, win rates, and pipeline velocity with AI.
Or try with a sample dataset:
Preview
What Is Pipeline Conversion Analysis?
Pipeline conversion analysis measures how efficiently opportunities move through the stages of a sales or business process — from initial lead or inquiry to final closed outcome — and quantifies the conversion rate, volume, and velocity at each transition. While a conversion funnel analysis focuses on user-level behavioral events (page visits, clicks), pipeline conversion is oriented toward deal-level or opportunity-level tracking in a CRM: each record represents a prospect, patient referral, or application that has been formally entered into the pipeline and must progress through defined qualification stages before closing.
The two most actionable metrics from pipeline analysis are stage-to-stage conversion rates (what % of opportunities entering each stage successfully advance to the next) and pipeline velocity — a composite metric that measures how quickly revenue flows through the pipeline: Pipeline Velocity = (Number of Opportunities × Win Rate × Average Deal Size) / Average Sales Cycle Length. A rep with 200 opportunities but a 10-day shorter sales cycle may generate more revenue per quarter than a rep with 250 opportunities and a longer cycle. Win rate by stage (the probability of ultimately closing, given a deal is currently at each stage) enables weighted pipeline forecasting — multiplying each stage's deal volume by its historical close probability gives a realistic revenue forecast.
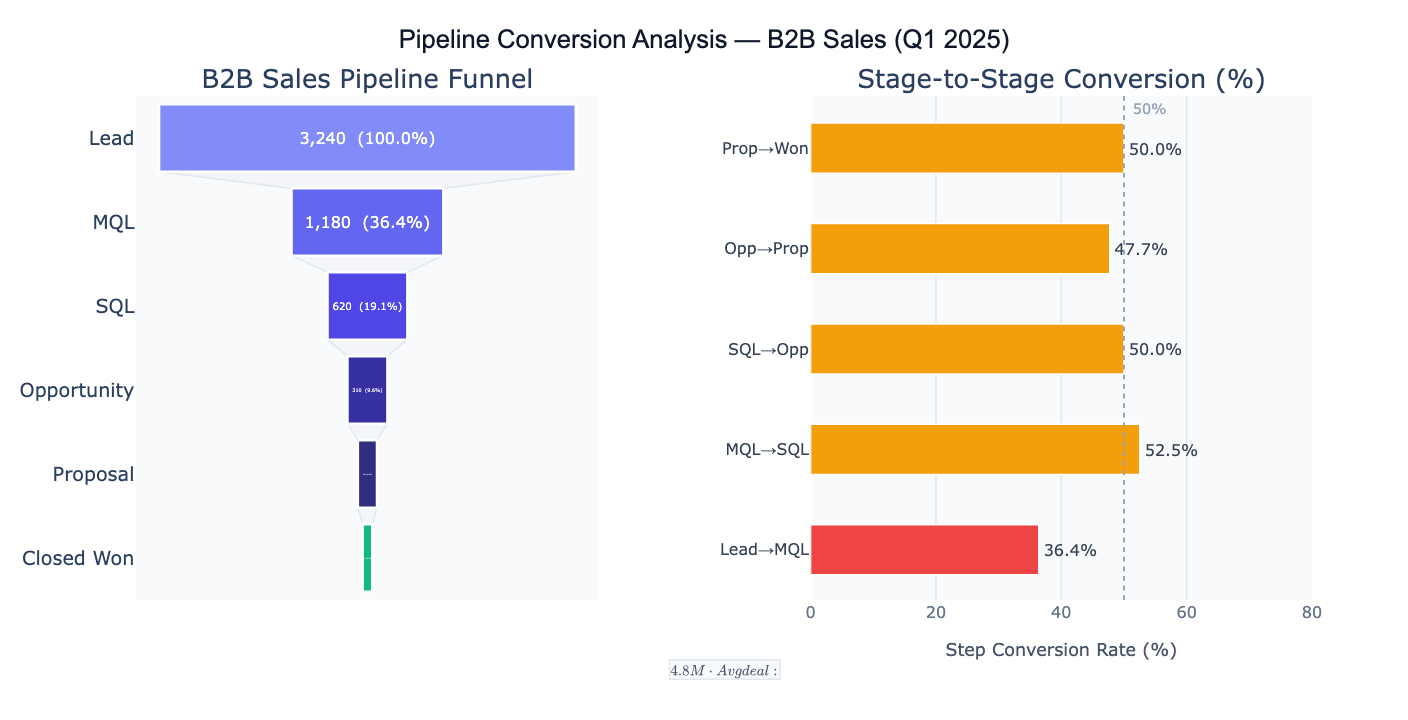
A concrete example: a B2B SaaS company analyzes 3,240 leads from Q1 2025. The overall win rate is 2.3% (74 closed deals). The MQL-to-SQL conversion (36.4%) is the largest relative bottleneck — over half the qualified leads fail to meet the sales-readiness criteria. Average deal size = 4.8M/quarter. Comparing by segment reveals that Enterprise deals have a 6.2% win rate but 90-day cycle, while SMB deals close at 1.8% in 22 days — informing how to balance the pipeline mix for quarterly targets.
How It Works
- Upload your data — provide a CSV or Excel file with one row per opportunity, a stage column (current or final stage), a date column, and optional columns for deal value, assigned rep, and segment.
- Describe the pipeline — e.g. "5 stages: Lead, MQL, SQL, Opportunity, Closed Won; compute stage-to-stage conversion rates; overall win rate; funnel chart; compare by sales rep"
- Get full results — the AI writes Python code using pandas and Plotly to compute conversion rates at each stage, pipeline velocity, average deal size and cycle length, and produce the funnel chart and stage comparison visualizations
Required Data Format
| Column | Description | Example |
|---|---|---|
stage | Current or final stage reached | SQL, Closed Won, Proposal |
deal_value | Optional: opportunity value | 45000, 12500 |
sales_rep | Optional: assigned rep | Alice, Bob |
created_date | Optional: opportunity creation date | 2024-01-15 |
closed_date | Optional: close date | 2024-03-02 |
segment | Optional: deal segment | Enterprise, SMB |
The stage column should contain the furthest stage reached (for closed/lost deals) or current stage (for open deals). Describe the stage ordering in your prompt. If you have separate columns for each stage date, describe that structure.
Interpreting the Results
| Output | What it means |
|---|---|
| Stage-to-stage conversion rate | % of opportunities that advance from one stage to the next |
| Overall win rate | % of all entered opportunities that ultimately close — typically 1–8% for B2B |
| Stage close probability | Historical % of deals at each stage that eventually close — used for weighted pipeline forecasting |
| Average deal size | Mean revenue per closed opportunity — filter by segment for accurate comparisons |
| Average sales cycle | Mean days from opportunity creation to close — key input for pipeline velocity |
| Pipeline velocity | Revenue generated per unit time = (Deals × Win Rate × Avg Deal Size) / Avg Cycle Days |
| Funnel chart | Visual of opportunity volume at each stage — shows where most deals are lost |
| Bottleneck stage | Stage with the largest absolute or relative drop-off — highest ROI target for improvement |
Example Prompts
| Scenario | What to type |
|---|---|
| Basic pipeline funnel | 5 pipeline stages in order; count at each stage; step conversion rates; funnel chart; overall win rate |
| Pipeline velocity | compute pipeline velocity: n_deals × win_rate × avg_deal_size / avg_cycle_days; compare by quarter |
| Rep comparison | stage conversion rates by sales rep; grouped bar chart; flag reps below average at each stage |
| Weighted forecast | multiply open opportunity count at each stage by historical close probability; sum = weighted pipeline forecast |
| Segment analysis | SMB vs Enterprise vs Mid-Market: win rate, deal size, cycle length, pipeline velocity per segment |
| Time trend | monthly win rate for past 12 months; line chart; is conversion improving or declining? |
| Lost deal analysis | at which stage are most deals lost? compute absolute and relative loss by stage; Pareto chart |
| Cycle length distribution | box plot of sales cycle length by stage and rep; identify reps with unusually long cycles |
Assumptions to Check
- Stage completeness — every opportunity should have a clear terminal state (Closed Won, Closed Lost) or a current active stage; opportunities with missing stage data distort conversion rates; decide whether to exclude or treat them as stalled at their last known stage
- Stage ordering consistency — pipeline stages must represent a defined sequential process; if deals can skip stages or move backwards, the standard funnel model overstates conversion rates at intermediate stages; verify stage ordering matches your actual sales process
- Time period boundary — conversion rates depend on the cohort definition; open opportunities created near the analysis end date haven't had time to close, deflating win rates; use a closed-cohort approach (only analyze opportunities created ≥ one full average sales cycle ago) for accurate win rate measurement
- Deal value outliers — a few very large deals can distort average deal size and pipeline velocity; report both mean and median deal values, and consider separate analysis for deals above a size threshold
Related Tools
Use the Conversion Funnel Analysis tool for user-behavioral event funnels (website visits, clicks, sign-ups) where the unit of analysis is a user action rather than a CRM deal. Use the Sales Forecasting Tool to project future closed revenue from the current pipeline using historical close probabilities by stage. Use the A/B Test Calculator to test whether a process change (new qualification criteria, additional nurture touchpoint) significantly improved a specific stage's conversion rate. Use the Lead Scoring Model to predict which opportunities at the top of the funnel are most likely to convert, enabling prioritization before they advance through the pipeline.
Frequently Asked Questions
What is a good win rate? Win rates vary substantially by market and pipeline definition. B2B enterprise SaaS typically sees 20–30% win rates from qualified opportunity (SQL) to close, and 2–5% from raw lead to close. Inside sales (SMB, self-serve) may close 5–15% of trials or demos. The most meaningful benchmark is your own historical rate by segment — and the trend direction (improving or declining) matters more than the absolute number. If a new sales process, qualification change, or market shift occurred, compare pre- and post-change win rates with a chi-square test to confirm whether the change was statistically significant.
What is pipeline velocity and how do I use it?Pipeline velocity = (Opportunities × Win Rate × Avg Deal Size) / Avg Cycle Length expresses how much revenue flows through the pipeline per unit time. It's most useful for comparing segments or time periods: if SMB velocity is 1.8M/quarter despite larger deal sizes, the longer Enterprise cycle is diluting revenue throughput. To improve velocity, you can increase any of the numerator terms (more deals, better win rate, larger deal size) or decrease the denominator (shorter cycle). Track velocity monthly to detect early changes before they appear in closed revenue.
My pipeline data has open opportunities — how should I handle them? For historical conversion analysis, filter to closed opportunities only (both Won and Lost). Open opportunities haven't reached a terminal state and will bias win rates downward if included. For pipeline forecasting, multiply the count of open deals at each stage by the historical stage-level close probability to produce a weighted forecast. For sales cycle analysis, only use closed deals with known creation and close dates — open deals have undefined cycle lengths. Describe which analysis you want and whether to include or exclude open deals.