Moving Median Filter Calculator
Apply moving median filters online to Excel or CSV data. Smooth noise, reduce spikes, and preserve robust trends with AI.
Or try with a sample dataset:
Preview
What Is a Moving Median Filter?
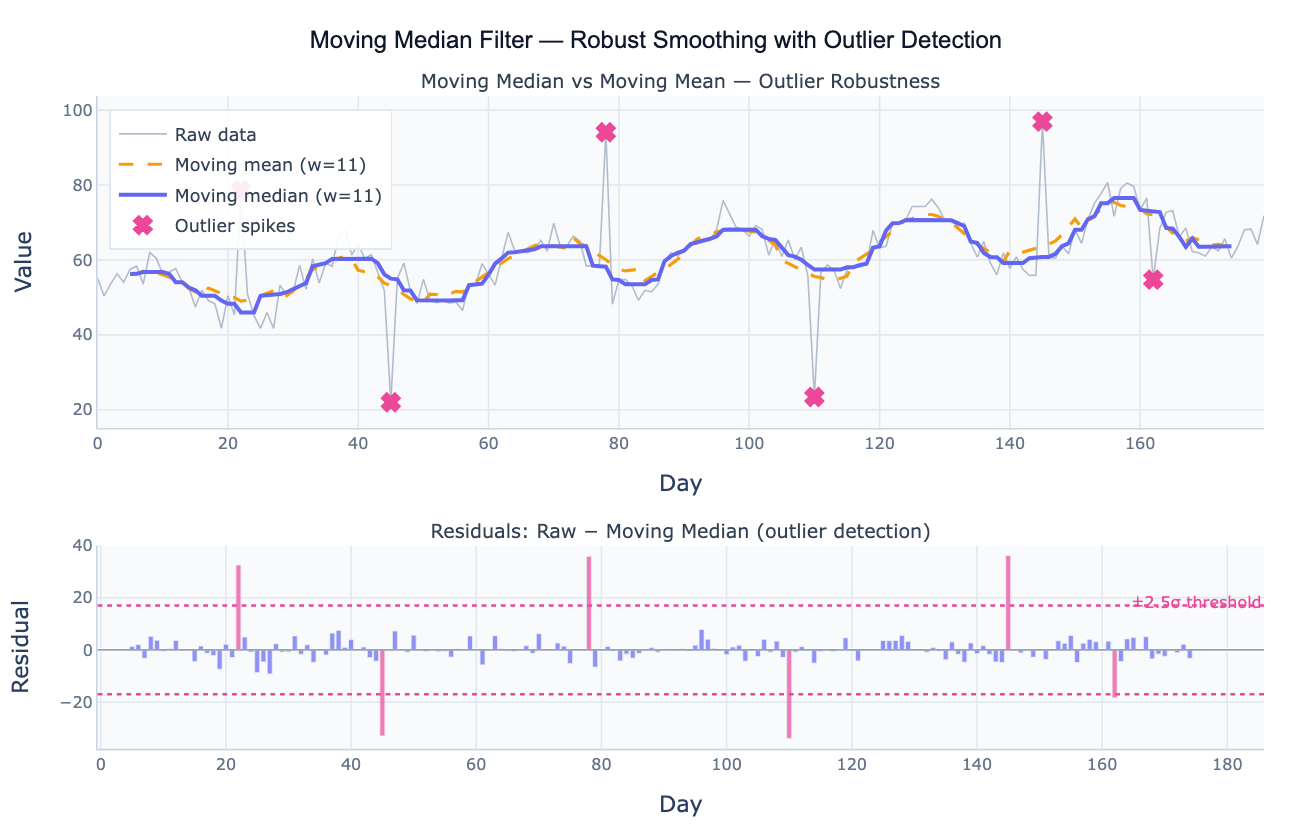
A moving median filter (also called a running median or median smoothing) replaces each data point in a time series with the median of the surrounding window of w observations. For a window of size 7 centered at time t, the filtered value is the median of observations at t−3, t−2, t−1, t, t+1, t+2, t+3. The result is a smoothed series that tracks the underlying signal while ignoring short-lived spikes. The key distinction from the more common moving average (which uses the mean of the window) is outlier robustness: a single extreme value in a window of 7 affects the median by at most one rank position, while it can shift the mean by an arbitrarily large amount. This makes the moving median the preferred smoother whenever the data contains impulsive noise, measurement errors, or abrupt spike artifacts.
The moving median filter is widely used in signal processing and data quality workflows. In epidemiological surveillance, daily case counts often contain reporting artifacts (late submissions, batch corrections) that create spikes unrelated to the true epidemic curve; a 7-day moving median tracks the real trend without being distorted by these artifacts. In financial data, price series sometimes contain data errors or flash crashes; a moving median suppresses these without smearing the surrounding valid prices the way a moving average would. In sensor data, a moving median is the standard approach for removing salt-and-pepper noise — isolated pixels or readings that are wildly different from their neighbors. The filter preserves step changes and edges in the underlying signal better than the moving average, which rounds them off.
The window size w controls the tradeoff between noise rejection and signal preservation. A large window (e.g. w = 21) produces a very smooth output but lags behind genuine signal changes. A small window (e.g. w = 3) reacts quickly but provides less noise suppression. The window must be odd so there is a well-defined center point. For outlier detection, the residuals (raw − moving median) are approximately symmetrically distributed around zero; points with large residuals (typically |residual| > 2–3 standard deviations) are statistical candidates for removal or investigation.
How It Works
- Upload your data — provide a CSV or Excel file with a date column and a value column. Daily, weekly, or monthly data all work. One row per time point.
- Describe the analysis — e.g. "moving median with window 7; compare to moving mean; plot residuals; flag values where |residual| > 2.5 SD as outliers"
- Get full results — the AI writes Python code using pandas rolling median and Plotly to overlay the raw series, moving median, and moving mean, plus a residual bar chart with outlier threshold lines
Required Data Format
| Column | Description | Example |
|---|---|---|
date | Date or timestamp | 2020-01-01, 2020-01, Jan 2020 |
value | Numeric time series | 245.3, 312.1, 198.8 |
Any column names work — describe them in your prompt. For non-time-ordered data (e.g. spatial transects), the moving median applies equally well — just describe the x-axis variable.
Interpreting the Results
| Output | What it means |
|---|---|
| Moving median line | Robust smoothed signal — unaffected by isolated spikes at either extreme |
| Moving mean line | Mean-based smooth — pulled toward outliers at each spike location |
| Residual = raw − median | Deviation of each point from the smooth; large residuals = outlier candidates |
| Outlier flags (> kσ) | Points where |residual| exceeds k standard deviations — adjust k (2 to 3) to taste |
| Lag | Centered window has zero lag; trailing window lags by (w−1)/2 — specify which you want |
| Edge behavior | First and last (w−1)/2 points have incomplete windows; use min_periods to include them |
| Window size w | Larger w = smoother output but more lag; smaller w = faster response but less smoothing |
Example Prompts
| Scenario | What to type |
|---|---|
| Basic smoothing | moving median filter window=7; overlay on raw data; compare to 7-day moving mean |
| Outlier detection | moving median window=11; compute residuals; flag dates where residual > 3 standard deviations |
| Window comparison | plot moving median for windows 5, 11, and 21; which window best preserves the trend shape? |
| Cleaned output | apply moving median window=7; replace outlier values (>2.5 SD from median) with the median value; export cleaned series as CSV |
| Sensor noise removal | moving median filter on sensor readings; compare to Gaussian smoothing (same effective width); which better preserves step changes? |
| Multiple series | apply 7-day moving median to each column in the dataset; plot all smoothed traces on one chart |
Assumptions to Check
- Impulsive noise model — the moving median is optimal when outliers are sparse and isolated (salt-and-pepper pattern); if the noise is Gaussian (no spikes), the moving mean achieves lower overall smoothing error
- Window must be odd — an even window has two central values and the median is ambiguous; use w = 3, 5, 7, 11, 21, etc.
- Centered vs trailing window — centered windows (equal observations before and after) introduce no time lag but require future data; trailing windows (all observations in the past) are causal and suitable for real-time use but introduce a lag of (w−1)/2 periods
- Step changes — the moving median preserves sharp step changes (unlike the moving mean, which rounds them); if your series has legitimate sudden shifts, this is a feature not a bug
- Regular spacing — like all rolling filters, the moving median assumes evenly spaced observations; for irregular timestamps, resample to a regular grid first
Related Tools
Use the Trendline Calculator when you want to fit a parametric trend (linear, exponential) rather than a nonparametric smoother. Use the Time Series Decomposition tool when you want to formally separate the series into trend, seasonal, and residual components rather than just smoothing. Use the Autocorrelation Plot (ACF) to check whether the residuals from a moving median filter are white noise (no remaining structure). Use the Seasonality Analysis tool to visualize repeating seasonal patterns that the moving median would otherwise smooth over.
Frequently Asked Questions
Why use a moving median instead of a moving average? The moving mean is sensitive to outliers — a single spike of 10× the normal value in a window of 7 shifts the mean by 1.4× the spike magnitude. The moving median is not affected at all by that spike as long as it remains the most extreme value in the window (which it typically does for an isolated spike). In practice, this means the median trace stays on the true signal while the mean trace shows a bump at every spike location. The tradeoff: for purely Gaussian noise with no outliers, the moving mean achieves slightly lower variance (the mean is the optimal estimator for Gaussian noise), so use the mean when you're confident there are no spikes and the median when you're not.
What window size should I use? Window size depends on the timescale of the signal you want to preserve versus the timescale of the noise you want to remove. A common approach: the signal changes on a scale of T periods (e.g. months), so use a window of roughly T/3 to T/5 periods so the filter smooths out shorter-term noise while tracking the signal. For daily COVID case data where the true epidemic changes over weeks, a 7-day window removes day-of-week reporting artifacts while tracking the weekly trend. For annual temperature data where the trend changes over decades, a 5-year window is appropriate. Ask the AI to "plot the smoothed series for windows 3, 7, 14, and 21; which best preserves the trend?"
How do I use the moving median to detect and remove outliers? The standard workflow: (1) compute the moving median with a window large enough to span several outlier-free points; (2) compute residuals = raw − median; (3) flag points where |residual| > k × MAD (or k × SD of the residuals), where k = 2.5 to 3.5 depending on tolerance; (4) replace flagged points with the median value, NaN, or a linearly interpolated value. Ask the AI to "apply moving median window=11; replace values more than 3 standard deviations from the median with linear interpolation; plot original and cleaned series".
What is the difference between a moving median and LOWESS smoothing? Both are nonparametric smoothers that handle noisy data without assuming a specific functional form. The moving median takes the exact median of a rectangular window — fast, simple, and highly robust to spikes, but it produces a slightly blocky output. LOWESS (locally weighted scatterplot smoothing) fits a local polynomial weighted by distance from the center point, producing a smoother curve that better tracks gradual curvature. LOWESS is less robust to extreme outliers than the moving median. For data with many spikes, use moving median. For noisy but spike-free data with smooth underlying trends, LOWESS often looks better.