Logistic Curve Fit
Fit logistic curves online from Excel or CSV data. Model S-shaped growth, saturation, and cumulative adoption patterns with AI.
Or try with a sample dataset:
Preview
What Is Logistic Growth?
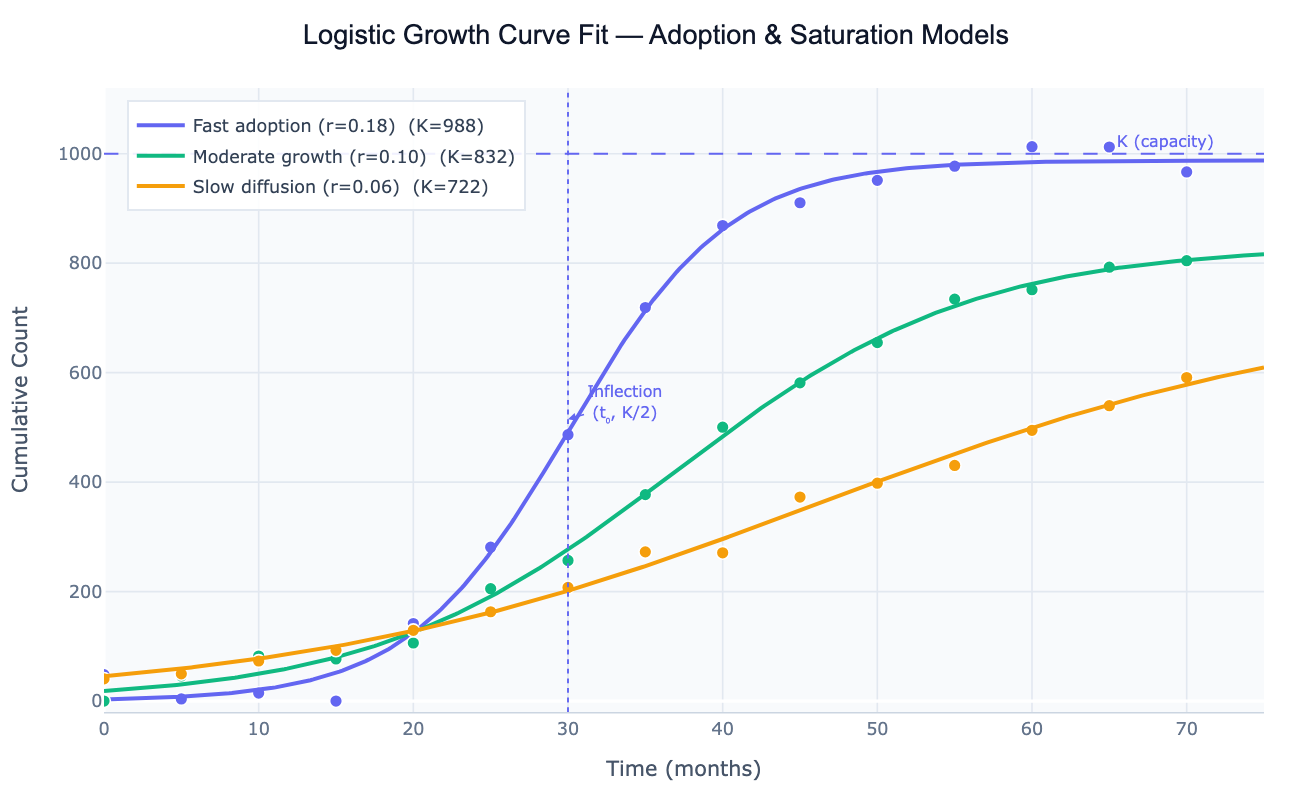
The logistic growth model describes processes that start with exponential acceleration, reach a point of fastest growth (the inflection point), then decelerate and asymptote toward a maximum called the carrying capacity K. The model is P(t) = K / (1 + exp(−r(t − t₀))), where K is the upper asymptote (saturation level), r is the intrinsic growth rate (steeper S-curve for larger r), and t₀ is the time of the inflection point (where the curve is growing fastest and has reached exactly K/2). The result is a symmetric S-shaped (sigmoidal) curve on a linear time axis.
Logistic growth is observed across a remarkable range of phenomena: population biology (a species colonizing a new habitat grows exponentially until resource limits impose carrying capacity), epidemiology (cumulative confirmed cases during an epidemic wave follow a logistic curve, with K representing the eventual total case count), technology adoption (internet users, smartphone penetration, electric vehicle sales — all follow S-curves as early adopters lead to mainstream diffusion and eventual market saturation), and bacterial growth (OD₆₀₀ curves in liquid culture). Fitting the logistic model extracts the three parameters that fully characterize the S-curve for comparison between conditions, prediction of the plateau, and estimation of when 50% or 90% of the final count will be reached.
How It Works
- Upload your data — provide a CSV or Excel file with a time column (dates, days, months, years) and a cumulative count or proportion column. The values should be monotonically increasing (or nearly so) and show signs of leveling off. One row per time point.
- Describe the analysis — e.g. "fit logistic growth curve to cumulative sales over 24 months; report K (saturation), r (growth rate), and t₀ (inflection month) with 95% CI; plot with confidence band"
- Get full results — the AI writes Python code using scipy.optimize.curve_fit to fit P(t) = K/(1+exp(−r(t−t₀))) and Plotly to render the S-curve with annotated K asymptote, inflection point marker, and parameter table
Required Data Format
| Column | Description | Example |
|---|---|---|
time | Time variable (numeric or date) | 1, 2, 3 … (months) or 2020-03-01 |
value | Cumulative count, proportion, or stock | 12, 45, 180, 620, 910 |
group | Optional: country, product, or condition | USA, Germany |
Any column names work. Values must be cumulative (monotonically non-decreasing) — do not use new-cases-per-day; convert to cumulative first.
Interpreting the Results
| Parameter | What it means |
|---|---|
| K (carrying capacity) | Upper plateau — predicted total at saturation; the most important output for forecasting |
| r (growth rate) | Steepness of the S-curve — higher r = faster transition from low to high |
| t₀ (inflection point) | Time of fastest growth — when P = K/2 and the curve switches from accelerating to decelerating |
| Doubling time near t₀ | ≈ ln(2)/r — time for the count to double when growth is fastest |
| Time to 90% K | t₀ + ln(9)/r — when 90% of the final plateau is reached |
| 95% CI on K | Uncertainty in the plateau — wide CI if the data hasn't clearly leveled off yet |
| Residuals | Should be random scatter; systematic arch = asymmetric growth (try Gompertz model) |
| R² | Goodness of fit — values > 0.99 are typical for clean S-curves |
Example Prompts
| Scenario | What to type |
|---|---|
| Epidemic wave | fit logistic to cumulative cases column 'total_cases'; report K and inflection date; annotate 50% and 90% saturation on plot |
| Market saturation | logistic curve to monthly cumulative sales; extract K (market size), r, and month of peak growth; predict when 95% saturation is reached |
| Multiple countries | fit logistic growth for each country in 'country' column; overlay S-curves; table of K, r, t₀ sorted by growth rate |
| Bacterial growth | fit logistic to OD600 readings over time; report lag phase end, maximum growth rate, and carrying capacity |
| Compare waves | fit separate logistic curves to wave 1 (months 1–8) and wave 2 (months 12–20); compare K and r between waves |
| Forecast | fit logistic to first 60% of the time series; project forward to saturation; show forecast with prediction interval |
Assumptions to Check
- Cumulative data required — the logistic model applies to cumulative totals, not rates or increments; if your data is daily new values, cumsum them first
- Visible inflection — parameter estimation is most reliable when the data shows both the accelerating phase and at least the beginning of deceleration; if data is still purely exponential, K is extrapolated with wide uncertainty
- Symmetric S-curve — the standard logistic model is symmetric around t₀; if the data shows a faster rise than fall (or vice versa), the Gompertz model (asymmetric S-curve) may fit better
- Single wave — the model fits one S-curve; multi-wave epidemics or seasonal adoption cycles require fitting separate logistic curves per wave
- No sudden drops — logistic growth is monotonically increasing; data corrections (negative adjustments to cumulative cases) violate the model and should be smoothed
Related Tools
Use the Dose-Response Curve Generator when your S-curve represents a pharmacological response to concentration (not a time series) — it uses the 4-parameter logistic with a free baseline. Use the Hill Equation Fit for sigmoidal concentration-response data with a Hill coefficient. Use the Survival Curve Generator when your data is time-to-event (not cumulative counts growing toward saturation). Use the Polynomial Regression tool when your data is curved but doesn't follow a saturation model.
Frequently Asked Questions
What is the difference between logistic growth and logistic regression? They share a mathematical form but model completely different things. Logistic growth (this tool) models how a cumulative quantity grows over time toward a carrying capacity — a time series model. Logistic regression (binary classification) models the probability that a categorical outcome occurs as a function of predictor variables — a classification model. The S-shaped curve is just a mathematical coincidence; the two methods are used in entirely different contexts.
My data hasn't leveled off yet — can I still estimate K? You can, but with wide uncertainty. If the curve is still in the exponential phase, K is essentially extrapolated from the growth rate alone, and small changes in r produce large changes in the estimated plateau. The 95% CI on K will be very wide. Best practice: report K as a lower bound (at least K_estimated) and refit as more data arrives. If K CI spans an order of magnitude, say the plateau is not yet estimable from current data.
What is the Gompertz model and when should I use it instead? The Gompertz model is P(t) = K × exp(−exp(−r(t − t₀))) — an asymmetric S-curve that rises faster than it levels off. Many biological growth processes (tumor growth, organ development, adoption of disruptive technologies) follow Gompertz rather than symmetric logistic kinetics. If your logistic fit shows systematic residuals where the early rise is underfit and the late plateau is overfit, try the Gompertz model. Ask the AI to "fit both logistic and Gompertz models and compare AIC".
How do I compute when 90% of the final value will be reached? The time to reach a fraction f of K is t(f) = t₀ + ln(f/(1−f))/r. For f = 0.90, t(0.90) = t₀ + ln(9)/r = t₀ + 2.197/r. For f = 0.99, t(0.99) = t₀ + ln(99)/r = t₀ + 4.595/r. Ask the AI to "compute the time to reach 90% and 99% of K from the fitted parameters".
My growth has multiple waves — how do I handle that? Fit each wave separately by subsetting the time range. Alternatively, use a sum of logistics model: P(t) = K₁/(1+exp(−r₁(t−t₁))) + K₂/(1+exp(−r₂(t−t₂))) + … — each term represents one wave. Ask the AI to "fit a double logistic (sum of two S-curves) to the data with two epidemic waves".