IC50 and EC50 Dose-Response Curve Calculator
Fit dose-response curves online from Excel or CSV data. Estimate IC50, EC50, Hill slope, and 4PL model parameters with AI.
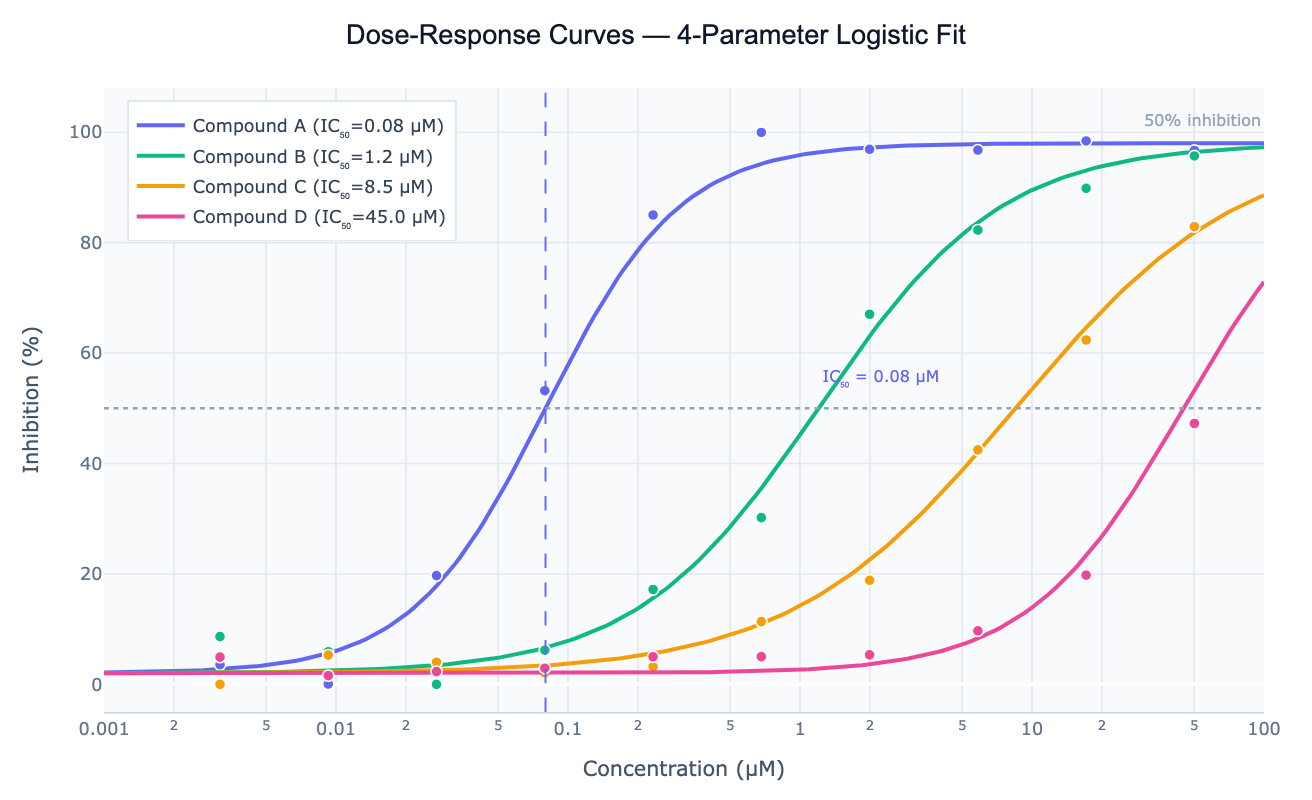
Preview
What Is a Dose-Response Curve?
A dose-response curve describes how a biological or chemical system responds as the concentration (dose) of a compound increases. In the most common form — a sigmoidal curve on a log-concentration axis — the response starts near a baseline at low concentrations, transitions through a steep inflection region, and saturates at a maximum (or minimum for inhibition) at high concentrations. The curve is typically fit with the 4-parameter logistic (4PL) model: Response = Bottom + (Top − Bottom) / (1 + (IC50/C)ⁿ), where Bottom and Top are the response plateaus, IC50 (or EC50) is the concentration at the midpoint (50% effect), and n (Hill slope) controls the steepness of the transition.
The IC50 (half-maximal inhibitory concentration) is the primary output in drug discovery screening — it ranks compounds by potency and guides lead selection. The EC50 (half-maximal effective concentration) is used for agonists and stimulatory compounds. The Hill slope (n) carries mechanistic information: n = 1 suggests a simple one-site interaction, n > 1 indicates cooperativity or a steep threshold response, and n < 1 suggests heterogeneous binding or a shallow transition. In high-throughput screening, dose-response curves are fit to 8–10 concentration points per compound across a 3–4 log-unit range, and IC50 values are compared across hundreds of compounds to build structure-activity relationships (SAR).
How It Works
- Upload your data — provide a CSV or Excel file with a concentration column and a response column. Include a compound or group column for multi-compound comparison. Replicate measurements can be separate rows.
- Describe the analysis — e.g. "4-parameter logistic fit for each compound in the 'drug' column; plot overlaid curves on log scale; IC50 table sorted by potency"
- Get full results — the AI writes Python code using scipy.optimize.curve_fit to fit the 4PL model and Plotly to render overlaid sigmoidal curves with IC50 markers, confidence bands, and a summary table
Required Data Format
| Column | Description | Example |
|---|---|---|
concentration | Compound concentration (any unit) | 0.001, 0.01, 0.1, 1, 10 (µM) |
response | Measured effect | 2, 15, 51, 88, 97 (% inhibition) |
compound | Optional: compound or treatment label | Drug A, Vehicle |
replicate | Optional: replicate number | 1, 2, 3 |
Any column names work — describe them in your prompt. Concentrations are typically log-spaced (0.001 to 100 µM is common).
Interpreting the Results
| Output | What it means |
|---|---|
| IC50 / EC50 | Concentration at 50% effect — primary potency measure; lower = more potent |
| Hill slope (n) | Steepness: n ≈ 1 (typical), n > 1 (steep/cooperative), n < 1 (shallow/heterogeneous) |
| Top plateau | Maximum response — should be near 100% for inhibition; low top = partial inhibitor |
| Bottom plateau | Baseline response — should be near 0%; nonzero bottom may indicate assay interference |
| 95% CI on IC50 | Fit precision — wide CI means the curve doesn't fully define the midpoint |
| pIC50 = −log₁₀(IC50) | Log-scale potency unit; pIC50 of 7 = IC50 of 100 nM; higher is more potent |
| Curve shift right | Less potent compound — same Hill slope, higher IC50 |
| Incomplete curve | Top or bottom plateau not reached — IC50 extrapolation, treat with caution |
Example Prompts
| Scenario | What to type |
|---|---|
| Single compound | 4PL fit to dose-response data; concentration column 'conc_uM', response 'pct_inhibition'; report IC50 with 95% CI |
| Multi-compound overlay | fit 4-parameter logistic for each compound in 'drug' column; overlay on log scale; IC50 table ranked by potency |
| Agonist EC50 | EC50 from dose-response; normalize response 0–100%; report EC50, Emax, and Hill slope |
| Replicate averaging | three replicates per concentration; fit 4PL to mean ± SD; show error bars |
| pIC50 table | fit all compounds; compute pIC50 = -log10(IC50); bar chart of pIC50 ranked highest to lowest |
| Partial inhibitors | fit 4PL allowing free top and bottom; flag compounds where top < 80% as partial inhibitors |
Assumptions to Check
- Log-spaced concentrations — dose-response fitting requires concentrations spanning several log units on either side of the IC50; a single decade of concentration range rarely constrains both plateaus
- Normalized response — curves are most interpretable when the response is normalized to 0% (vehicle control) and 100% (maximum effect); raw signal values work but make comparisons harder
- Symmetric sigmoid — the standard 4PL assumes a symmetric sigmoidal shape; asymmetric curves need a 5-parameter logistic (5PL) with an asymmetry parameter
- No activity at vehicle (0% at C = 0) — if vehicle controls show nonzero effect, the bottom plateau is constrained incorrectly; include vehicle wells and normalize
- Sufficient concentrations above and below IC50 — if all tested concentrations are below IC50, only the lower plateau is observed and IC50 is extrapolated; similarly for concentrations all above IC50
Related Tools
Use the Hill Equation Fit when you want to analyze the Hill coefficient in the context of cooperative binding or receptor pharmacology, or when your model has a fixed baseline (3-parameter rather than 4PL). Use the Enzyme Kinetics Fit for substrate-velocity data and Michaelis-Menten analysis rather than inhibitor dose-response. Use the Logistic Regression tool when your response is binary (cell alive/dead, infection yes/no) rather than a continuous graded effect.
4PL Curve Fit
The 4-parameter logistic (4PL) model — y = Bottom + (Top − Bottom) / (1 + (EC50/x)ⁿ) — is the standard curve-fitting model for dose-response and calibration data. It has four parameters: Bottom (lower asymptote), Top (upper asymptote), EC50/IC50 (midpoint concentration), and n (Hill slope / steepness). To fit a 4PL curve to your data, upload a CSV or Excel file with concentration and response columns and prompt:
"fit 4-parameter logistic to columns 'conc_nM' and 'response'; report Bottom, Top, EC50, and Hill slope with 95% CI; plot on log scale"
The 4PL is the default model for most dose-response experiments. Use it unless your curve is visibly asymmetric (upper and lower slopes differ), in which case use the 5PL model below.
5PL Curve Fit
The 5-parameter logistic (5PL) model adds a fifth parameter f (asymmetry factor) to the 4PL: y = Bottom + (Top − Bottom) / (1 + (EC50/x)ⁿ)^f. When f = 1, it reduces to the standard 4PL. When f ≠ 1, the upper and lower arms of the sigmoid have different steepness — the curve is asymmetric. 5PL is the preferred model for ELISA standard curves, multiplex immunoassay calibration, and any dose-response where the response rises more steeply on one side of the inflection than the other.
To fit a 5PL curve, prompt:
"fit 5-parameter logistic to my data; report all five parameters (Bottom, Top, EC50, n, f) with 95% CI; compare AIC to 4PL to confirm asymmetry is real"
If the 5PL AIC is not meaningfully lower than 4PL (ΔAIC < 2), the extra parameter is not justified and you should use the 4PL result.
EC50 Calculator
The EC50 (half-maximal effective concentration) is the agonist equivalent of IC50 — the concentration that produces 50% of the maximum stimulatory response. It is the standard potency measure for receptor agonists, growth factors, cytokines, and any compound that activates rather than inhibits a system. To calculate EC50:
- Upload a CSV or Excel file with concentration and response columns (response in % effect, RLU, OD, or any units)
- Prompt: "calculate EC50 — concentration column is 'conc_nM', response column is 'activation_pct'; normalize 0–100%; report EC50 with 95% CI and Emax"
- The AI fits the 4PL curve and reads the EC50 at the 50% activation crossover, reporting EC50, Emax (maximum effect), Hill slope, and pEC50 (−log₁₀ EC50 in molar)
For multi-compound EC50 comparison, include a compound label column and ask for an overlay plot and ranked EC50 table.
IC50 Calculator
The IC50 (half-maximal inhibitory concentration) is the single most important number in inhibition assays — it tells you the concentration of a compound required to cut the measured signal in half. To calculate IC50 from your data:
- Upload a CSV or Excel file with a concentration column and a percent inhibition column
- Prompt: "calculate IC50 — concentration column is 'conc_uM', response column is 'inhibition_pct'; fit 4PL and report IC50 with 95% confidence interval"
- The AI fits the 4-parameter logistic curve and reads off the IC50 at the 50% response crossover point
The result includes the IC50 value with 95% CI, the Hill slope, the pIC50 (−log₁₀ IC50 in molar, the standard unit for SAR tables), and a plot showing the fitted curve with the IC50 marked. For multiple compounds, a ranked IC50 table is generated automatically.
| IC50 range | Potency classification |
|---|---|
| < 10 nM (pIC50 > 8) | Very potent |
| 10–100 nM (pIC50 7–8) | Potent |
| 100 nM – 1 µM (pIC50 6–7) | Moderate |
| 1–10 µM (pIC50 5–6) | Weak |
| > 10 µM (pIC50 < 5) | Inactive in most assays |
Frequently Asked Questions
What is the difference between IC50 and Ki?IC50 is an empirical, assay-dependent value — it measures the concentration causing 50% inhibition under specific assay conditions (substrate concentration, enzyme concentration, time). Ki is the true thermodynamic inhibition constant — a measure of binding affinity that does not depend on assay conditions. The Cheng-Prusoff equation converts IC50 to Ki for competitive inhibitors: Ki = IC50 / (1 + S/Km). Ask the AI to apply the Cheng-Prusoff correction if you know the Km and substrate concentration.
Should I use a 3-parameter or 4-parameter logistic model? Use the 4-parameter logistic (4PL) as the default — it fits both plateaus freely and is standard in pharmacology. Use the 3-parameter model (fixed bottom = 0 or fixed top = 100) only when you have enough data to confirm the plateau value and want to reduce overfitting. For asymmetric curves, use the 5-parameter logistic (5PL). Ask the AI to "fit 4PL and 5PL and compare AIC to choose the better model".
My curve never reaches 100% inhibition — is the IC50 still valid? A compound that only achieves 60–80% inhibition at the highest tested concentration is a partial inhibitor (or the assay concentration range is too narrow). The IC50 can still be estimated from the 4PL fit if the midpoint is within the tested range, but the Top parameter will be less than 100. Report the Imax (maximum inhibition) alongside IC50 to distinguish potent partial inhibitors from inactive compounds.
How do I convert IC50 to pIC50 and why?pIC50 = −log₁₀(IC50 in molar) is a log-scale potency measure used because IC50 values span many orders of magnitude and are log-normally distributed. A pIC50 of 7 corresponds to IC50 = 100 nM; pIC50 of 9 = 1 nM. pIC50 values are more symmetric, suitable for statistical analysis (t-tests, ANOVA), and directly comparable across labs. Ask the AI to "compute pIC50 for all compounds and report mean ± SD".
How many concentration points do I need for a reliable IC50? The minimum is typically 8–10 concentrations spanning at least 3 log units, with 2–3 concentrations above and below the IC50. Fewer points or a narrower range increase IC50 uncertainty. For screening purposes, 10-point concentration-response (CR) curves from 0.003 µM to 100 µM are standard. Three-point or five-point abbreviated curves are sometimes used for throughput but give wider confidence intervals.