Hill Equation Fit Calculator
Fit Hill equations online from Excel or CSV data. Estimate EC50, slope, cooperativity, and sigmoidal response curves with AI.
Preview
What Is the Hill Equation?
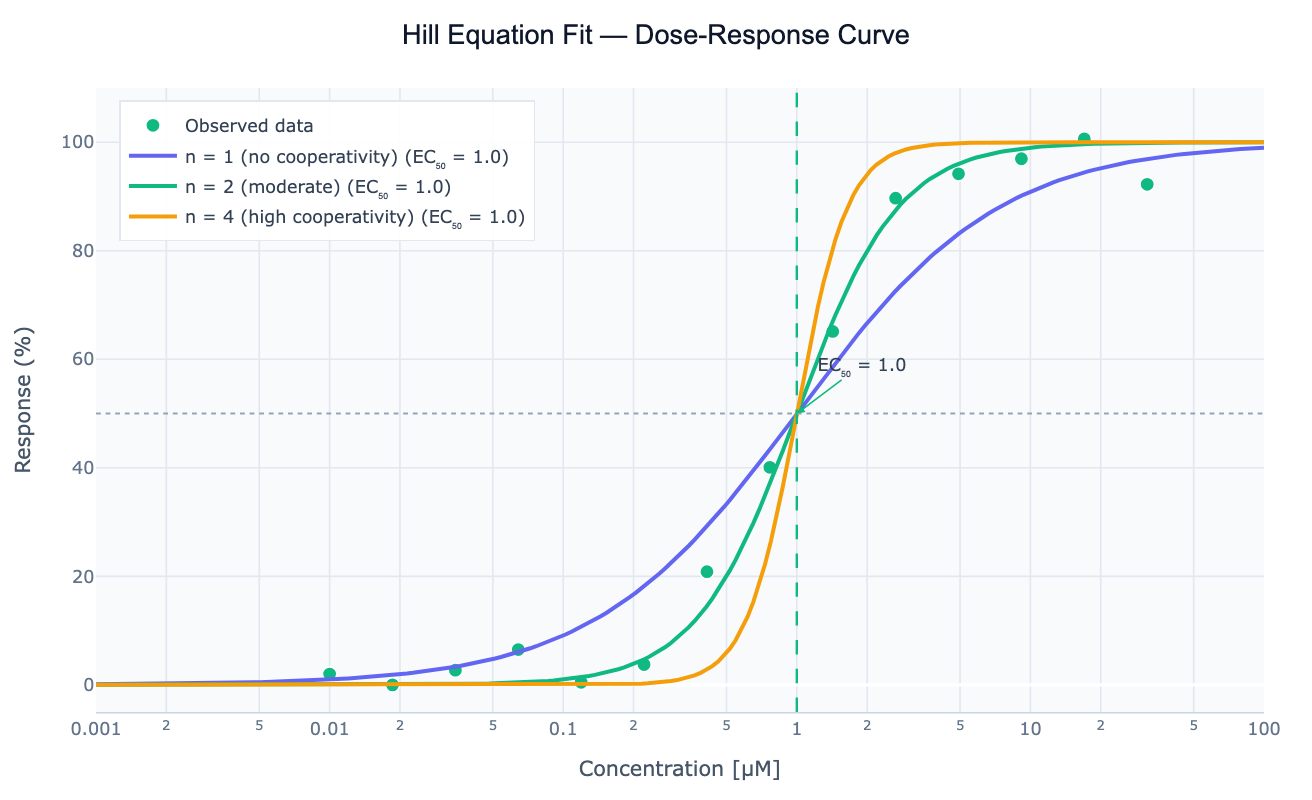
The Hill equation is a sigmoidal mathematical model that describes how a response variable — enzyme activity, receptor occupancy, drug effect, fluorescence signal — saturates as stimulus concentration increases. It takes the form Response = Emax × Cⁿ / (EC50ⁿ + Cⁿ), where Emax is the maximum response, EC50 (or IC50 for inhibition) is the concentration at half-maximal effect, and n is the Hill coefficient that controls the steepness of the sigmoid. When n = 1 the curve reduces to simple Michaelis-Menten hyperbolic saturation; when n > 1 the curve is steeper (cooperative binding or steep dose-response); when n < 1 it is shallower (negative cooperativity or heterogeneous binding sites).
The Hill coefficient was first derived to describe the cooperative binding of oxygen to hemoglobin (n ≈ 2.8) — where binding of one oxygen molecule increases the affinity for subsequent molecules. Today the Hill equation is the standard model for IC50 determination in drug discovery (what concentration inhibits 50% of activity?), EC50 determination in pharmacology (what concentration produces 50% of the maximum effect?), activation curves in neuroscience (action potential gating), and binding curves in biochemistry (ligand-receptor or ligand-DNA interactions). The parameters are extracted by nonlinear least-squares fitting using the Levenberg-Marquardt algorithm.
How It Works
- Upload your data — provide a CSV or Excel file with a concentration column (numeric, any units) and a response column (numeric: percent inhibition, fluorescence, activity, occupancy). Optional: a group or replicate column for multiple curves.
- Describe the analysis — e.g. "fit Hill equation to columns 'concentration_uM' and 'inhibition_pct'; extract IC50, Hill coefficient, and Emax with 95% confidence intervals; plot on log scale"
- Get full results — the AI writes Python code using scipy.optimize.curve_fit to fit the Hill equation and Plotly to render the sigmoidal curve with data points and confidence bands
Required Data Format
| Column | Description | Example |
|---|---|---|
concentration | Stimulus or drug concentration (any unit) | 0.01, 0.1, 1.0, 10 (µM) |
response | Measured effect | 5, 28, 51, 89 (%) |
group | Optional: compound or condition label | Drug A, Drug B |
Any column names work — describe them in your prompt.
Interpreting the Results
| Parameter | What it means |
|---|---|
| EC50 / IC50 | Concentration producing 50% of maximum effect — the primary potency measure |
| Emax | Maximum response asymptote — 100% for normalized data, actual maximum for raw data |
| Hill coefficient (n) | Sigmoidal steepness: n=1 (simple hyperbolic), n>1 (cooperative/steep), n<1 (shallow) |
| 95% CI on EC50 | Precision of the potency estimate — narrower CI = better-constrained fit |
| R² | Goodness of fit — values > 0.99 are typical for clean dose-response data |
| Residual plot | Check for systematic pattern — random scatter confirms model is appropriate |
| Steep sigmoid (large n) | Cooperative system or a threshold-like switch |
| Flat sigmoid (small n) | Heterogeneous binding sites or measurement at narrow concentration range |
Example Prompts
| Scenario | What to type |
|---|---|
| Basic fit | fit Hill equation, concentration column is 'dose_uM', response is 'inhibition_pct'; report IC50 with 95% CI |
| Multiple compounds | fit Hill curves for each compound in the 'drug' column; overlay on one plot; rank by IC50 |
| Cooperative binding | Hill equation fit with Hill coefficient; annotate EC50 and n; is n significantly different from 1? |
| Log-scale plot | sigmoidal dose-response fit on log10 concentration axis; add EC50 and 90% effect markers |
| Normalized data | normalize response 0–100% then fit Hill equation; report EC50, n, and goodness of fit |
| Inhibition with baseline | fit 4-parameter Hill (bottom, top, IC50, n); concentrations 0.001–100 µM |
Assumptions to Check
- Monotone response — the Hill equation assumes response strictly increases (or decreases) with concentration; non-monotone data (e.g. bell-shaped) requires a different model
- Wide enough concentration range — the dataset should span from near-baseline to near-Emax; fitting only the steep middle region cannot reliably estimate EC50 or Emax
- Replicate measurements — single measurements at each concentration have no internal error estimate; include at least n=3 technical replicates per concentration
- Appropriate baseline — if the response does not start near 0 at low concentrations (e.g. partial agonist with non-zero floor), use the 4-parameter Hill equation with a free bottom parameter
- Independence — if the same sample is remeasured, observations are not independent; treat as technical replicates, not independent data points
Related Tools
Use the Michaelis-Menten Fit when your data follows a simple hyperbolic (non-sigmoidal) saturation model — enzyme velocity vs. substrate concentration without cooperativity. Use the Lineweaver-Burk Plot to linearize enzyme kinetics data and identify inhibition type. Use the Logistic Regression tool when your outcome is binary (event/no event) rather than a continuous graded response.
Frequently Asked Questions
What is the difference between EC50 and IC50?EC50 (half-maximal effective concentration) applies to activation assays — the concentration that produces 50% of the maximum stimulation (e.g. receptor agonists, enzyme activators). IC50 (half-maximal inhibitory concentration) applies to inhibition assays — the concentration that reduces activity by 50% (e.g. enzyme inhibitors, cytotoxicity, viral plaque reduction). Both are extracted identically from a Hill equation fit; the naming just reflects the direction of the effect.
My Hill coefficient is much greater than 1 — is that biologically meaningful? A Hill coefficient n > 1 indicates positive cooperativity — binding of the first ligand increases affinity for subsequent ones. Classic example: hemoglobin (n ≈ 2.8). However, in pharmacological dose-response curves, n > 2 often reflects a steep but not mechanistically cooperative response — the Hill coefficient then serves as an empirical steepness descriptor rather than a literal measure of binding sites.
How do I compare IC50 values across compounds statistically? Fit each compound's curve independently to get IC50 and its standard error, then compare with a t-test on log(IC50) values (since IC50 follows a log-normal distribution). Alternatively, fit all curves simultaneously in a global model and test whether the IC50 parameters are equal. Ask the AI to "fit Hill curves for each compound and report IC50 with 95% CI for pairwise comparison".
What is the 4-parameter Hill equation and when do I need it? The standard (3-parameter) Hill equation assumes the response starts at exactly 0 at zero concentration and reaches exactly Emax at high concentration. The 4-parameter logistic (4PL) adds a free bottom parameter: Response = Bottom + (Top − Bottom) × Cⁿ / (EC50ⁿ + Cⁿ). Use 4PL when your data has a non-zero baseline (e.g. partial agonist, background fluorescence) or does not reach 100% inhibition.
My curve looks sigmoidal but R² is low — what is wrong? Low R² with a visually good fit usually indicates high measurement noise or only 1–2 replicates. Check the residual plot — if residuals are random and small relative to the response range, the fit is fine despite low R². Low R² with a systematic residual pattern (S-shaped residuals) means the Hill equation is the wrong model — try a biphasic Hill equation or a Gaussian peak model.