Michaelis-Menten Calculator for Enzyme Kinetics
Fit Michaelis-Menten curves online from Excel or CSV data. Estimate Vmax, Km, and enzyme saturation behavior with AI.
Preview
What Is the Michaelis-Menten Equation?
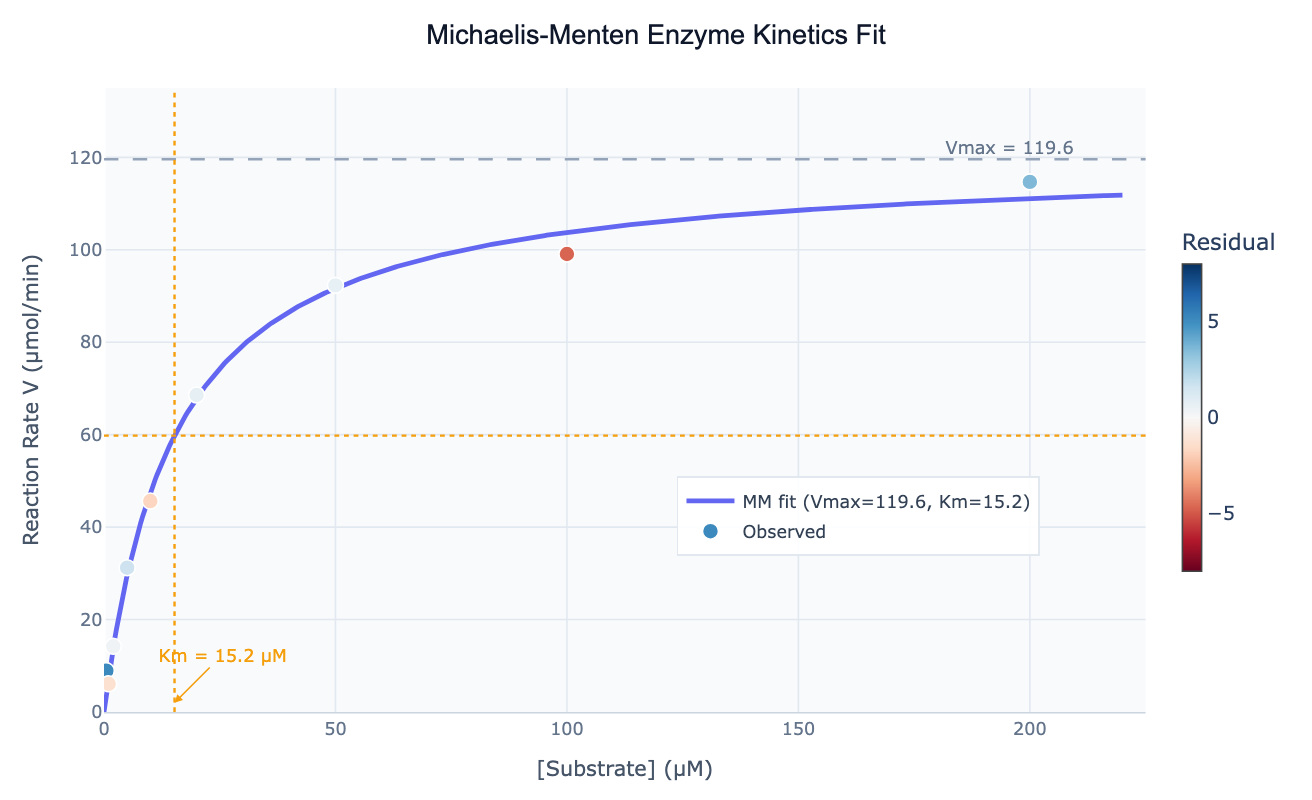
The Michaelis-Menten equation describes the relationship between substrate concentration and the initial reaction rate for a large class of enzymes that follow simple hyperbolic kinetics. The model is V = Vmax × S / (Km + S), where V is the initial reaction velocity, S is the substrate concentration, Vmax is the theoretical maximum velocity reached when the enzyme is fully saturated, and Km is the Michaelis constant — the substrate concentration at which V = Vmax/2. Km is often interpreted as an approximate measure of binding affinity: a low Km means the enzyme reaches half-saturation at low substrate concentration (high apparent affinity), while a high Km means the enzyme requires more substrate to achieve the same fractional saturation.
The Michaelis-Menten model was derived in 1913 by Leonor Michaelis and Maud Menten from the assumption that enzyme (E) and substrate (S) reversibly form an enzyme-substrate complex (ES), which then irreversibly breaks down to product (P) and releases the enzyme. The two kinetic constants — Vmax and Km — fully characterize the enzyme's catalytic behavior under the assay conditions. They are the foundation for understanding enzyme efficiency (the catalytic efficiency kcat/Km), substrate specificity (comparing Km across different substrates), and the mechanism of inhibition (how inhibitors change Vmax, Km, or both). In drug discovery, measuring Km for the target enzyme and comparing it to the IC50 of inhibitors helps prioritize compounds.
How It Works
- Upload your data — provide a CSV or Excel file with a substrate concentration column and an initial rate (velocity) column. Each row is one measurement. Include replicates as separate rows.
- Describe the analysis — e.g. "Michaelis-Menten fit to columns 'S_mM' and 'rate_umol_per_min'; report Vmax and Km with 95% CI and standard error; plot with hyperbolic fit curve"
- Get full results — the AI writes Python code using scipy.optimize.curve_fit to fit V = Vmax×S/(Km+S) and Plotly to render the saturation curve with data points, parameter annotations, and Vmax asymptote
Required Data Format
| Column | Description | Example |
|---|---|---|
substrate | Substrate concentration (any unit) | 0.5, 1, 5, 10, 50 (µM) |
rate | Initial reaction velocity | 12.3, 35.7, 61.2 (µmol/min) |
enzyme | Optional: enzyme variant or condition | WT, Mutant K45A |
Any column names work — describe them in the prompt.
Interpreting the Results
| Output | What it means |
|---|---|
| Vmax | Maximum velocity when enzyme is fully saturated with substrate |
| Km | Substrate concentration at half-maximal velocity — lower = higher apparent affinity |
| kcat | Turnover number (Vmax / Etotal) — reactions per enzyme per second; include enzyme concentration |
| kcat/Km | Catalytic efficiency — higher is better; enzymes near diffusion limit have kcat/Km ≈ 10⁸–10⁹ M⁻¹s⁻¹ |
| Curve plateau | Vmax asymptote — if data never plateaus, Vmax and Km are poorly constrained |
| 95% CI | Narrow CI indicates well-constrained fit; wide CI means data at saturation is insufficient |
| Residual plot | Should be random scatter; systematic curvature suggests wrong model (inhibition, cooperativity) |
Example Prompts
| Scenario | What to type |
|---|---|
| Basic fit | Michaelis-Menten fit, substrate column 'S_uM', rate column 'V_umol_min'; report Vmax and Km with 95% CI |
| Compare enzymes | fit MM curves for each enzyme variant in 'variant' column; overlay plots; table of Vmax and Km |
| Catalytic efficiency | MM fit; enzyme concentration is 2 nM; compute kcat and kcat/Km |
| Residuals check | fit Michaelis-Menten and plot residuals vs substrate concentration to check model adequacy |
| Multiple substrates | fit MM for each substrate type and compare Km values — which substrate has highest affinity? |
| With error bars | triplicate measurements in rows; fit MM to mean; show error bars from SD; plot |
Assumptions to Check
- Initial rates only — the Michaelis-Menten equation applies to initial velocities measured when substrate depletion and product inhibition are negligible (typically < 10% substrate consumed)
- Steady-state kinetics — the derivation assumes the ES complex reaches a steady state; this holds when S >> E, which is true for most practical assays
- Single substrate — the basic MM equation assumes one substrate; for two-substrate reactions use ping-pong or ordered bi-bi kinetics
- No product inhibition — if product accumulates and inhibits the enzyme, initial rates become nonlinear over time; use shorter time windows
- Sufficient substrate range — data should span from S << Km to S >> Km (at least 10-fold above Km) to reliably estimate both parameters; fitting data that doesn't plateau severely inflates Km and Vmax uncertainty
Related Tools
Use the Lineweaver-Burk Plot to visualize the same data as a double reciprocal plot and identify inhibition type from the pattern of lines. Use the Hill Equation Fit when your saturation curve is sigmoidal rather than hyperbolic — indicating cooperativity or a Hill coefficient ≠ 1. Use the Enzyme Kinetics Fit for a combined analysis that includes MM fitting, inhibition models, and Lineweaver-Burk in one workflow.
Frequently Asked Questions
How do I tell if my data actually follows Michaelis-Menten kinetics? Plot V vs S — the curve should be a hyperbola that levels off at Vmax. If the curve is sigmoidal (S-shaped), the enzyme is cooperative and needs the Hill equation. If it has a substrate inhibition hump (decreasing at very high S), the model is V = Vmax×S/(Km + S×(1+S/Ki)). Check the residual plot after fitting — a random scatter confirms MM is appropriate; a systematic S-shaped residual means the wrong model was used.
My Km and Vmax have very wide confidence intervals — what is wrong? Wide confidence intervals almost always mean the substrate concentration range is too narrow. If you never have S >> Km (data doesn't plateau), Vmax cannot be estimated from the data — it requires extrapolation. Add data points at higher substrate concentrations. If that is not possible, report Vmax and Km as rough estimates and note the extrapolation uncertainty.
What is the difference between Km and Kd?Km is a kinetic constant: the substrate concentration at V = Vmax/2. It reflects both the binding equilibrium and the catalytic step. Kd is a true thermodynamic dissociation constant: the equilibrium concentration at which half the enzyme is bound. For slow enzymes (kcat << k₋₁), Km ≈ Kd. For fast enzymes, Km > Kd. They are not interchangeable.
How do I compute kcat from Vmax?kcat = Vmax / Etotal, where Etotal is the total enzyme concentration in the same units as Vmax/time. For example, if Vmax = 50 µmol/min and Etotal = 5 nM, then kcat = 50 µmol/min ÷ 5 nM = 10⁷ min⁻¹ (after unit conversion). Ask the AI to "compute kcat given enzyme concentration of 5 nM".
Can I fit inhibited data with the Michaelis-Menten tool? Yes — run separate MM fits for each inhibitor concentration. The pattern tells you the inhibition type: if Km increases but Vmax stays constant → competitive inhibition. If Vmax decreases but Km stays constant → noncompetitive/uncompetitive inhibition. Use the Lineweaver-Burk Plot to visualize all curves together, which makes the inhibition pattern immediately visible.