Enzyme Kinetics Calculator for Excel & CSV
Analyze enzyme kinetics online from Excel or CSV data. Fit Michaelis-Menten models, compare inhibition, and inspect residuals with AI.
Preview
What Is Enzyme Kinetics Analysis?
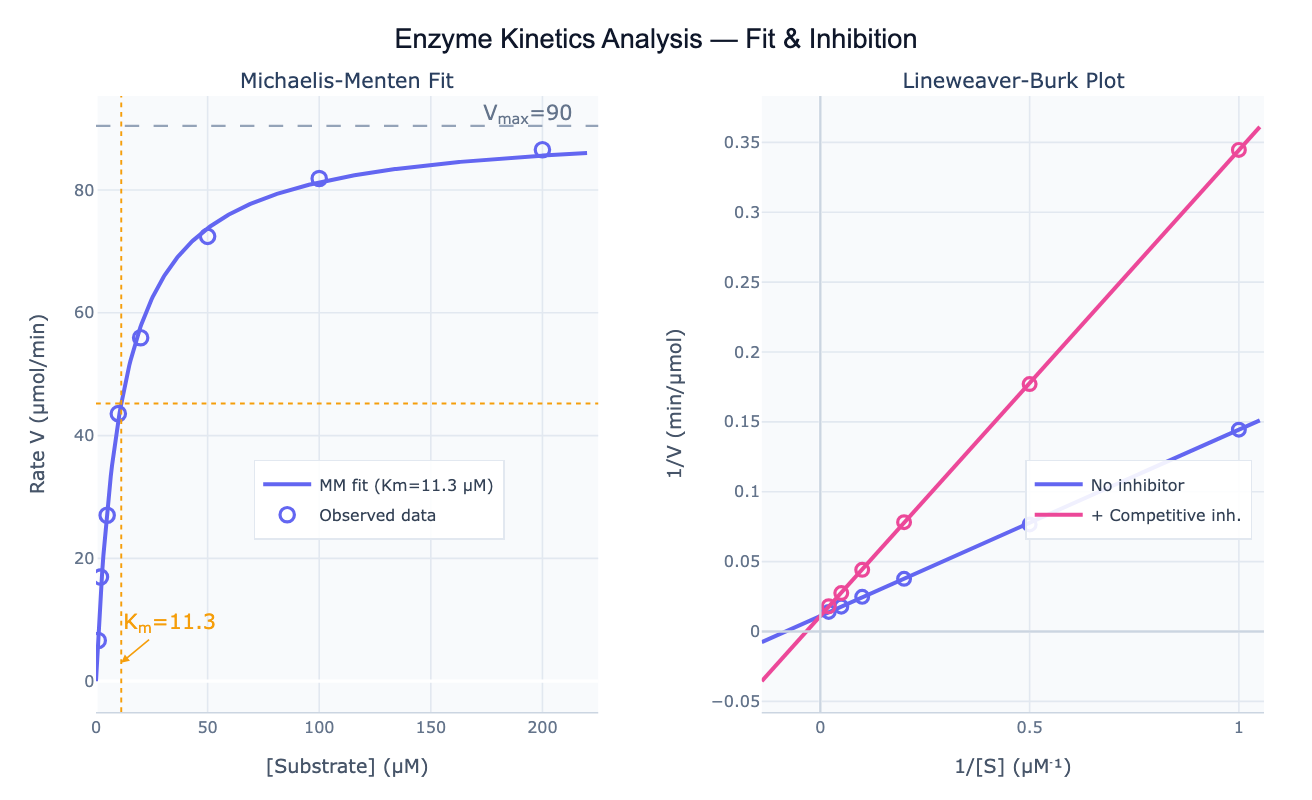
Enzyme kinetics is the quantitative study of how fast enzymes catalyze reactions and how that rate depends on substrate concentration, enzyme concentration, pH, temperature, and the presence of inhibitors or activators. The core experimental measurement is the initial reaction rate (V) as a function of substrate concentration (S) — a dataset that, when fit to the appropriate mathematical model, yields the kinetic constants that characterize the enzyme: Vmax (maximum catalytic rate), Km (substrate concentration at half-maximal rate), and kcat (catalytic turnover number). These constants are the fundamental descriptors used to compare enzymes across species, assess mutations, screen inhibitory compounds, and understand metabolic flux.
The most common models are the Michaelis-Menten equation (hyperbolic saturation, single substrate, no cooperativity), the Hill equation (sigmoidal saturation for cooperative enzymes), and the inhibition models — competitive (substrate and inhibitor compete for the same active site), noncompetitive (inhibitor binds elsewhere and reduces Vmax), uncompetitive (inhibitor only binds the enzyme-substrate complex), and mixed (inhibitor affects both Km and Vmax independently). Identifying which inhibition model applies is essential for drug discovery: competitive inhibitors are overcome by increasing substrate (problematic in vivo if substrate concentrations fluctuate), while noncompetitive inhibitors cannot be overcome by substrate and are often more therapeutically reliable.
How It Works
- Upload your data — provide a CSV or Excel file with at minimum a substrate concentration column and an initial rate column. For inhibition analysis, include an inhibitor concentration column or a condition label column.
- Describe the analysis — e.g. "fit Michaelis-Menten for each inhibitor concentration in column 'inh_uM'; create Lineweaver-Burk plot; determine inhibition type from intersection pattern; estimate Ki"
- Get full results — the AI writes Python code using scipy.optimize for nonlinear fitting, numpy for linear regression of reciprocal data, and Plotly for the saturation curve, Lineweaver-Burk plot, and parameter summary table
Kinetic Models Available
| Model | Equation | When to use |
|---|---|---|
| Michaelis-Menten | V = Vmax·S / (Km + S) | Simple hyperbolic kinetics, no cooperativity |
| Hill equation | V = Vmax·Sⁿ / (EC50ⁿ + Sⁿ) | Sigmoidal curve (n ≠ 1), cooperative kinetics |
| Competitive inhibition | V = Vmax·S / (Km·(1+I/Ki) + S) | Inhibitor competes with substrate |
| Noncompetitive inhibition | V = Vmax·S / ((Km + S)·(1+I/Ki)) | Inhibitor binds outside active site, reduces Vmax |
| Uncompetitive inhibition | V = Vmax·S / (Km + S·(1+I/Ki)) | Inhibitor only binds ES complex |
| Substrate inhibition | V = Vmax·S / (Km + S + S²/Ki) | Rate decreases at high substrate (hump-shaped curve) |
Interpreting the Results
| Output | What it means |
|---|---|
| Vmax | Maximum reaction velocity — increases proportionally with enzyme concentration |
| Km | Half-saturation constant — lower = higher apparent affinity for substrate |
| kcat = Vmax/E | Turnover number (reactions/enzyme/sec) — intrinsic catalytic speed |
| kcat/Km | Catalytic efficiency — the gold standard for enzyme-substrate pair comparison |
| Ki | Inhibitor constant — lower Ki means tighter inhibitor binding |
| Hill coefficient n | Cooperativity: n > 1 (positive), n < 1 (negative), n = 1 (Michaelis-Menten) |
| Lineweaver-Burk intersection | On y-axis = competitive; on x-axis = noncompetitive; parallel lines = uncompetitive |
Example Prompts
| Scenario | What to type |
|---|---|
| Full kinetics workflow | MM fit, Lineweaver-Burk plot, and inhibition analysis for inhibitor column 'drug_uM'; extract Km, Vmax, Ki |
| Inhibition type | Lineweaver-Burk for 0, 10, 50 µM inhibitor; identify inhibition mechanism; estimate Ki |
| Cooperative kinetics | fit Hill equation and compare to MM; report Hill coefficient and test if n differs from 1 |
| kcat/Km efficiency | enzyme concentration is 1.5 nM; fit MM; compute kcat and kcat/Km; compare to diffusion limit |
| Substrate inhibition | fit substrate inhibition model V = Vmax·S/(Km + S + S²/Ki); annotate optimal [S] at Vmax |
| Mutant vs wildtype | fit MM for WT and each mutant in 'enzyme' column; bar chart comparing Km and kcat/Km |
Assumptions to Check
- Initial rates — V must be measured at early time points before substrate depletion or product inhibition; plot progress curves to confirm linearity
- E << S — the Michaelis-Menten derivation requires total substrate to exceed total enzyme by at least 100-fold; otherwise use tight-binding inhibitor corrections
- Steady state — the ES complex must equilibrate faster than substrate is consumed; satisfied for most lab-scale assays
- Correct inhibition model — selecting the wrong model underestimates Ki; use the Lineweaver-Burk pattern to pre-select the model, then confirm by AIC/BIC comparison
- Enzyme stability — if the enzyme loses activity during the assay (thermal inactivation, oxidation), initial rates are not constant and the MM model is invalid; pre-incubate controls confirm stability
Related Tools
Use the Michaelis-Menten Fit for a focused single-enzyme hyperbolic fit without inhibition analysis. Use the Lineweaver-Burk Plot to generate publication-ready double reciprocal plots and visually classify inhibition type. Use the Hill Equation Fit when your data shows a sigmoidal (cooperative) response rather than hyperbolic saturation. Use the Residual Plot Generator to check the adequacy of any fitted kinetic model by examining model residuals.
Frequently Asked Questions
How do I decide which kinetic model to use before fitting? Start by plotting V vs S on a regular scale. If the curve is hyperbolic and levels off → Michaelis-Menten. If it is S-shaped → Hill equation. If it rises then falls → substrate inhibition. Then, if you have inhibitor data, create a Lineweaver-Burk plot and look at the intersection pattern of inhibited vs uninhibited lines to select the inhibition model. The AI can do this diagnosis automatically if you ask it to "test all inhibition models and select the best fit by AIC".
What units should my data be in? Any consistent units work — the AI will carry them through. Common conventions: substrate in µM or mM, time in minutes or seconds, rate in µmol/min, nmol/min, or absorbance units/min. For kcat calculation you also need enzyme concentration in matching molar units. Describe your units in the prompt: "substrate in µM, rate in nmol/min per mg protein, enzyme is 5 nM".
My Km value changed dramatically with a mutation — is that a Km or kcat effect? Both can change with mutations. Always report kcat and kcat/Km alongside Km. If Km increases but kcat stays constant, the mutation impairs substrate binding (binding site mutation). If kcat decreases but Km stays constant, the mutation impairs catalysis (active site mutation). If both change, ask the AI to "fit MM for WT and mutant; report Km, Vmax, kcat, and kcat/Km with 95% CI for each".
How do I estimate Ki from dose-response inhibition data (not initial rate data)? The Cheng-Prusoff equation converts IC50 to Ki: Ki = IC50 / (1 + S/Km). Ask the AI to "use the Cheng-Prusoff equation: IC50 = 15 µM, S = 20 µM, Km = 10 µM — calculate Ki". This requires knowing the Km and the substrate concentration used in the assay. For a full IC50-to-Ki conversion with confidence intervals, also provide the Hill coefficient from the dose-response fit.
Can I analyze progress curves rather than initial rates? Yes — progress curve analysis fits a differential equation model directly to the full time course, extracting Km and kcat without requiring initial rate measurement. Ask the AI to "fit integrated Michaelis-Menten to progress curve data; columns 'time_s' and 'product_uM'; report Km and kcat". This is especially useful when substrate concentrations are too low to measure initial rates accurately.