Intraclass Correlation Coefficient Calculator
Calculate ICC online from Excel or CSV data. Assess inter-rater, intra-rater, and test-retest reliability with AI.
Or try with a sample dataset:
Preview
What Is the Intraclass Correlation Coefficient?
The intraclass correlation coefficient (ICC) is the standard measure of reliability for continuous measurements — it quantifies how consistent or interchangeable measurements are when made by different raters, instruments, or test occasions. Unlike Pearson's r (which requires exactly two variables and ignores systematic bias), ICC can handle any number of raters, accounts for both systematic and random sources of disagreement, and is defined as the ratio of between-subject variance to total variance (between-subject + within-subject + error). ICC ranges from 0 (no reliability — all variance is random error) to 1 (perfect reliability — all variance reflects true between-subject differences).
The key conceptual distinction in ICC is between consistency and absolute agreement. Consistency asks whether raters rank subjects in the same order — it ignores systematic bias (one rater always scoring 3 points higher than another). Absolute agreement additionally requires that raters give the same numerical values — it penalizes systematic differences between raters. For instrument interchangeability (e.g., can device A replace device B?), absolute agreement is appropriate. For assessing whether raters can discriminate between subjects (e.g., ranking pain severity), consistency is sufficient. Shrout and Fleiss (1979) and McGraw and Wong (1996) provide the definitive taxonomy: ICC(1,1) — one-way random, single measures; ICC(2,1) — two-way mixed/random, absolute agreement, single measures; ICC(3,1) — two-way mixed, consistency, single measures; and their average-measures counterparts ICC(1,k), ICC(2,k), ICC(3,k).
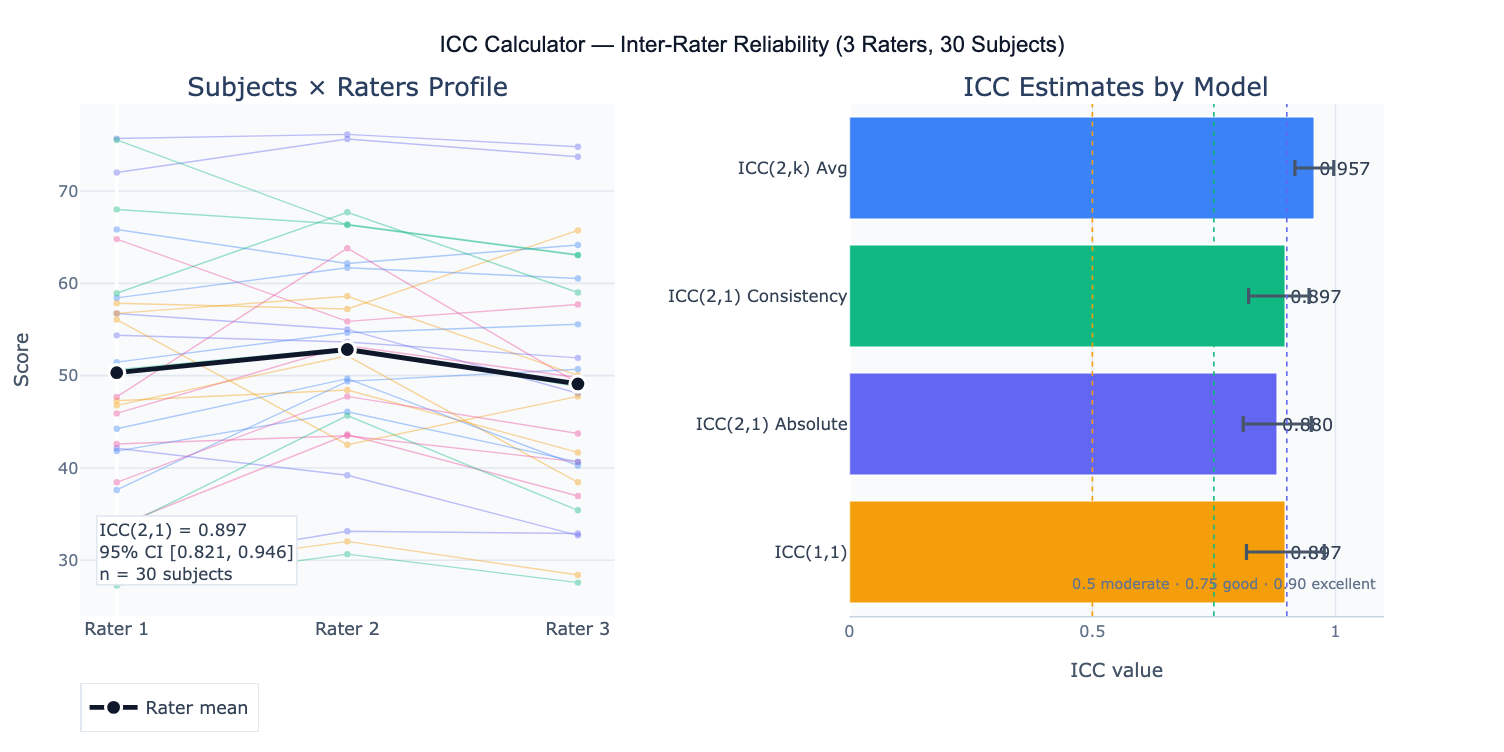
A practical example: three physical therapists rate shoulder abduction range-of-motion in 30 patients. ICC(2,1) absolute agreement = 0.89 (95% CI: 0.82–0.94), classified as "good" reliability. The profile plot reveals that Rater 2 consistently scores 3° higher than the other two raters — a systematic bias that makes absolute agreement lower than consistency (ICC(2,1) consistency = 0.92). The standard error of measurement (SEM = SD × √(1−ICC)) = 4.2° indicates the typical measurement error for a single rater. The minimal detectable change (MDC₉₅ = 1.96 × √2 × SEM) = 11.7° gives the threshold above which a change in a patient's score can be attributed to a real change rather than measurement error.
How It Works
- Upload your data — provide a CSV or Excel file in wide format: one row per subject, one column per rater/measurement occasion. Include a subject ID column if available.
- Describe the design — e.g. "3 raters, 30 subjects, pain scale 0–10; compute ICC(2,1) absolute agreement; 95% CI; profile plot; SEM and MDC; classify reliability"
- Get full results — the AI writes Python code using pingouin or scipy to compute the appropriate ICC, 95% CI via F-distribution, variance components, SEM, MDC, and produce the profile plot and ICC summary table
Required Data Format
| Column | Description | Example |
|---|---|---|
subject | Subject/item identifier | P001, P002 |
rater1 | Scores from rater 1 | 6.2, 8.5, 4.1 |
rater2 | Scores from rater 2 | 5.8, 8.9, 4.4 |
rater3 | Optional: additional rater | 6.0, 8.3, 4.6 |
Wide format only (one row per subject, one column per rater). If data are in long format (one row per rating), ask the AI to pivot to wide format first. All measurements must be on the same numeric scale. Missing values exclude that subject from the analysis.
Interpreting the Results
| Output | What it means |
|---|---|
| ICC point estimate | Proportion of total variance due to true subject differences — higher = more reliable |
| 95% CI | Uncertainty in the ICC estimate — always report; wide CI with small n is common |
| ICC model | Which of the 6 Shrout-Fleiss models was used — must match the study design |
| Reliability classification | Poor < 0.50 · Moderate 0.50–0.75 · Good 0.75–0.90 · Excellent ≥ 0.90 (Koo & Mae, 2016) |
| SEM | Standard Error of Measurement = SD × √(1−ICC) — absolute measurement precision in original units |
| MDC₉₅ | Minimal Detectable Change = 1.96 × √2 × SEM — smallest real change detectable above measurement noise |
| Variance components | Between-subject, between-rater, and residual variance — identifies the primary source of unreliability |
| Profile plot | Rater scores per subject with group means — reveals systematic rater bias visually |
Example Prompts
| Scenario | What to type |
|---|---|
| Basic 2-rater ICC | 2 raters, 25 subjects; ICC(2,1) absolute agreement; 95% CI; classify reliability; scatter plot rater1 vs rater2 |
| Test-retest | test and retest scores for same instrument; ICC(3,1) consistency; SEM; MDC95; Bland-Altman plot of difference vs mean |
| 3+ raters | 4 raters, 30 subjects; ICC(2,1) and ICC(2,4) average measures; compare single vs average reliability; profile plot |
| Variance components | compute variance components: between-subject, between-rater, residual; pie chart; identify main source of unreliability |
| Absolute vs consistency | compute both ICC(2,1) absolute and ICC(2,1) consistency; compare; if they differ substantially, report rater bias |
| SEM and MDC | ICC(2,1); compute SEM and MDC95 in original units; interpret: what score change is clinically meaningful vs noise? |
| Two-way ANOVA table | full two-way ANOVA table underlying the ICC: SS, df, MS for subjects, raters, residual; F-tests |
| Minimum sample size | how many subjects needed to estimate ICC ≥ 0.75 with CI width ≤ 0.20? compute with 3 raters |
Assumptions to Check
- Correct ICC model for the design — the most common error in ICC analysis is using the wrong model; use ICC(1,1) when raters are randomly sampled and each subject is rated by a different random subset of raters; use ICC(2,1) when all subjects are rated by the same raters AND raters are considered a random sample from a larger pool (e.g., any physical therapist); use ICC(3,1) when all subjects are rated by the same raters AND these are the only raters of interest (fixed raters); if you want to generalize to new raters, use ICC(2,1), not ICC(3,1)
- Normal distribution of scores — ICC is derived from ANOVA and assumes normally distributed subject scores; check with Q-Q plot; with large n (> 50 subjects) the ANOVA is robust to non-normality; for ordinal scales with few categories, consider weighted kappa instead
- No systematic rater×subject interactions — standard ICC assumes raters differ from each other by a constant bias (one rater always scores 2 points higher); if bias depends on the subject (e.g., raters disagree more for severe cases), the two-way ANOVA residuals will be large and ICC will be artificially deflated; inspect the profile plot for crossing lines
- Homoscedasticity — measurement error should be constant across the measurement range; if variability increases with the score magnitude (common in biological measurements), consider log-transforming the data before computing ICC
- Sufficient sample size — reliable ICC estimates require n ≥ 30 subjects; the 95% CI width for ICC ≈ 0.80 is approximately ±0.15 at n = 30 and narrows to ±0.08 at n = 100; for regulatory submissions (device validation, clinical test reliability), n ≥ 50–100 subjects is recommended
Related Tools
Use the Bland-Altman Plot Generator alongside ICC — ICC quantifies the proportion of variance due to subjects, while the Bland-Altman plot visualizes the actual magnitude of disagreement between two measurement methods in original units; for method comparison studies, both are required. Use the Cronbach's Alpha Calculator when items are parallel indicators of a latent construct (psychometric reliability) rather than repeated measurements of the same physical quantity — Cronbach's alpha and ICC(2,k) consistency are mathematically equivalent in the two-way mixed model. Use the Linear Mixed Effects Model Calculator when ICC is a secondary output (the model's random intercept variance / total variance) in a longitudinal study where the primary goal is estimating fixed effects. Use the Power Analysis Calculator to determine sample size needed to estimate ICC with a target CI width.
Frequently Asked Questions
Which ICC model should I use? Follow the Koo and Mae (2016) decision tree: (1) Are all subjects rated by the same raters? If NO → ICC(1,1). If YES → (2) Are the raters a random sample from a larger pool (you want to generalize to new raters)? If YES → ICC(2,1). If NO (these specific raters are the only ones of interest) → ICC(3,1). Then: (3) Is the goal to use a single rater's score in practice? → single measures ICC (the k=1 version). Is the goal to average multiple raters' scores? → average measures ICC(k). For clinical outcome measurement validation, ICC(2,1) absolute agreement is typically most appropriate because you want the measurement to be reliable across any trained clinician, not just the specific raters in the study.
What is the difference between SEM and MDC? The Standard Error of Measurement (SEM) = SD × √(1−ICC) quantifies the typical magnitude of measurement error for a single measurement — it is in the same units as the original scale. A patient's true score is estimated to be within ±1.96 × SEM of their observed score with 95% probability. The Minimal Detectable Change (MDC₉₅) = 1.96 × √2 × SEM is the smallest change in score between two measurement occasions that exceeds measurement error with 95% confidence — any change smaller than MDC₉₅ cannot be distinguished from random fluctuation. Example: if SEM = 3 points on a pain scale, MDC₉₅ = 1.96 × √2 × 3 = 8.3 points — a patient's pain must decrease by at least 8.3 points to confidently claim a real improvement. MDC should be contrasted with the Minimal Clinically Important Difference (MCID), which is determined by patient-reported outcomes, not psychometrics.
My ICC is high (0.85) but raters clearly disagree — what went wrong? High ICC with visible rater disagreement usually means: (1) large between-subject variance — if subjects vary enormously in their true scores, even large absolute rater differences produce a high ICC (ICC measures relative agreement, not absolute agreement); (2) wrong ICC model — if you used consistency ICC when absolute agreement was needed, systematic rater biases are ignored; (3) small absolute error relative to range — with a 0–100 scale and subjects spanning the full range, 5-point rater differences produce high ICC even though 5 points may be clinically meaningful. Always report both ICC and SEM/MDC together — ICC alone is insufficient for clinical decision-making.
How many raters and subjects do I need? The precision of the ICC estimate (CI width) depends on both the number of subjects (n) and raters (k). Adding subjects narrows the CI more efficiently than adding raters. Rough guidance for ICC ≈ 0.70–0.85: to achieve 95% CI width ≤ 0.20, you need approximately n = 30 subjects with k = 2 raters, or n = 20 with k = 3 raters. For CI width ≤ 0.10 (regulatory-grade precision): n ≈ 100 with k = 2, or n ≈ 60 with k = 3. Use a dedicated ICC sample size calculator (e.g., Bonett's method) for exact calculations with your target ICC and acceptable CI width.