Peak Finder
Find peaks online from Excel or CSV data. Detect maxima, rank prominence, and measure spacing and widths with AI.
Or try with a sample dataset:
Preview
What Is Peak Detection?
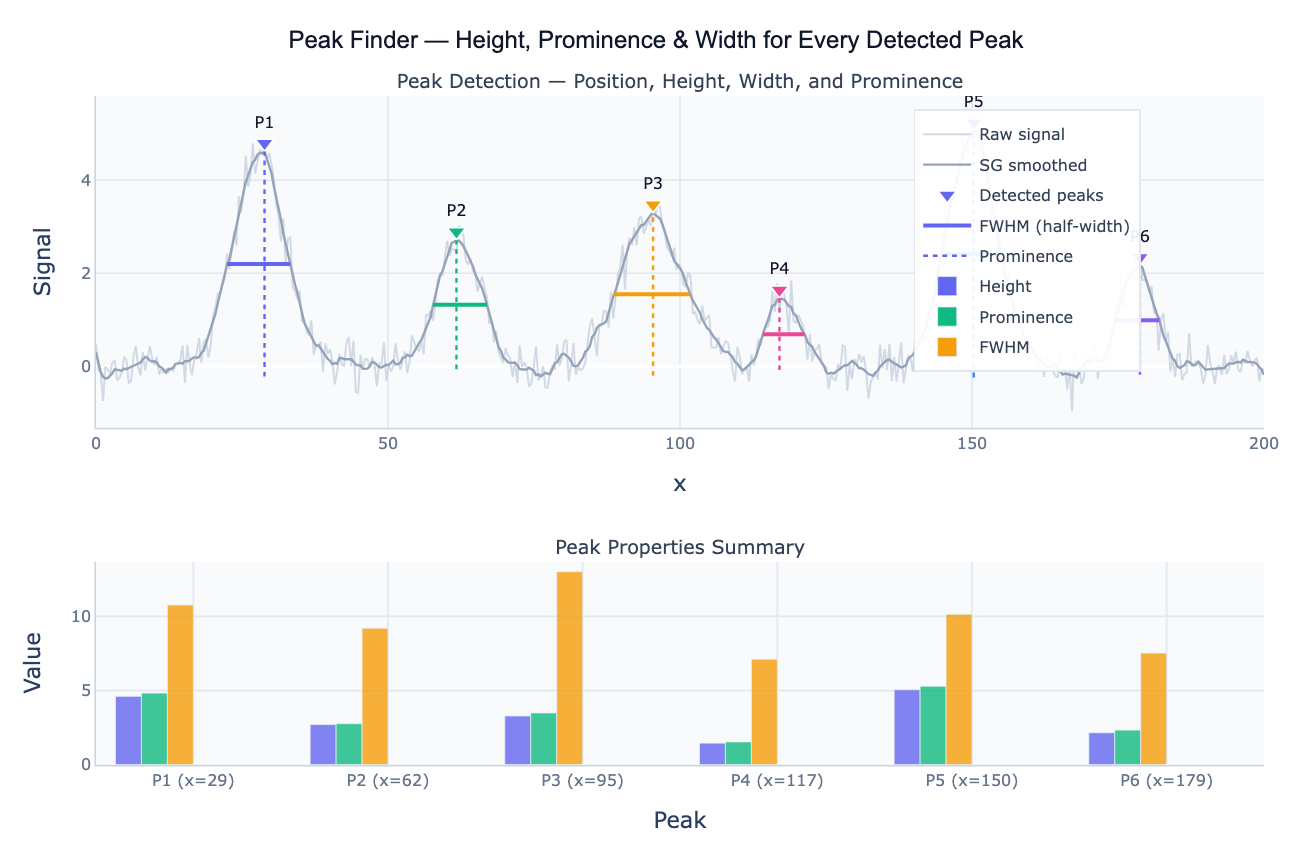
Peak detection (also called peak finding) is the task of automatically identifying local maxima — points higher than their immediate neighbors — in a signal and characterizing their properties. A peak is a local maximum: a point where the signal is higher than the surrounding points for some distance on both sides. The most useful peak properties are height (the absolute signal value at the peak), prominence (how much the peak stands out above the surrounding baseline — the key measure of peak "importance"), and width (the extent of the peak at a specified relative height, typically 50%, giving the FWHM — full width at half maximum). These three properties together characterize every detected peak and enable filtering, ranking, and interpretation.
Prominence is the most important peak property for filtering out noise and minor fluctuations. It is defined as the height of the peak above the highest point in the valley between the peak and the nearest higher peak. A tall peak on a high plateau has low prominence; a smaller peak standing alone above a flat baseline has high prominence. Prominence-based filtering — "find all peaks with prominence > 0.5" — is far more robust than height-based filtering — "find all peaks above 2.0" — because it naturally ignores shoulders and ripples on the flanks of large peaks without requiring separate baseline correction. This makes scipy.signal.find_peaks with the prominence parameter the standard tool for real-world peak detection.
Peak detection applies across a remarkable range of domains. In spectroscopy, each peak in an IR, Raman, or NMR spectrum corresponds to a molecular vibration or resonance — the position identifies the functional group and the area is proportional to concentration. In chromatography, each peak in a chromatogram is a separated compound — the retention time identifies it and the area quantifies it. In time series analysis, peaks in sales data identify demand spikes; peaks in a temperature record identify warm events; peaks in an ECG trace identify heartbeats. In all these cases, the output is a peak table: a row per detected peak with columns for position, height, prominence, width, and area.
How It Works
- Upload your data — provide a CSV or Excel file with an x column (time, wavenumber, index) and a y column (signal, intensity, value). One row per data point.
- Describe the analysis — e.g. "find all peaks with height > 1.5 and prominence > 0.3; report positions, heights, FWHM widths, and areas; sort by prominence"
- Get full results — the AI writes Python code using scipy.signal.find_peaks and Plotly to detect peaks, annotate the signal with markers and FWHM bars, and output a complete peak table
Required Data Format
| Column | Description | Example |
|---|---|---|
x | Independent variable (position, time, wavenumber) | 400, 401, 402 (cm⁻¹) or 1, 2, 3 (time) |
y | Signal value | 0.23, 1.45, 2.81 (intensity, counts, value) |
Any column names work — describe them in your prompt. If the data is noisy, ask the AI to apply Savitzky-Golay smoothing before peak detection.
Interpreting the Results
| Output | What it means |
|---|---|
| Peak position (x₀) | x-value at the maximum — wavelength, retention time, frequency, date |
| Peak height | Signal value at the peak — absolute magnitude |
| Prominence | How much the peak stands above its surrounding baseline — key for ranking peaks |
| Width (FWHM) | Full width at half maximum — peak extent at 50% of height above the base |
| Area / integral | Integral of the peak above the baseline — proportional to amount (chromatography, spectroscopy) |
| Left / right base | x-positions where the peak descends to the valley baseline on each side |
| Peak table | One row per detected peak with all properties — sortable and exportable |
| Prominence threshold | Peaks below this prominence are noise / shoulders — increase to reduce detections |
Example Prompts
| Scenario | What to type |
|---|---|
| Basic detection | find peaks with minimum height 0.5 and minimum prominence 0.2; annotate positions and heights |
| Chromatogram | find all chromatogram peaks with prominence > 1000 counts; report retention times and peak areas; sort by area |
| Spectral peaks | detect NMR peaks with minimum prominence 0.1; report chemical shifts, heights, and FWHM linewidths |
| Time series extrema | find both peaks (maxima) and troughs (minima) in monthly sales; annotate on time series; report seasonal amplitude |
| Prominence filter | find all peaks; plot prominence vs height; which peaks have prominence > 2× noise level? |
| Smoothed detection | apply SG filter (window=21) before peak detection; compare detected peaks on raw vs smoothed signal |
Assumptions to Check
- Smooth before detecting —
find_peaksoperates on the raw signal; noise creates many spurious local maxima; Savitzky-Golay smoothing before detection dramatically reduces false positives without broadening real peaks - Set minimum distance — the
distanceparameter enforces a minimum number of samples between detected peaks; without it, shoulders and ripples on a single broad peak are detected as multiple peaks; set distance to at least half the expected minimum inter-peak spacing - Prominence vs height threshold — for baseline-corrected signals,
heightworks well; for signals with varying baselines,prominenceis more reliable because it measures height relative to the local surrounding rather than the absolute zero - Trough detection —
find_peaksdetects maxima only; for troughs (local minima), pass the negated signal:find_peaks(-y, ...) - Overlapping peaks — peaks that share a common base are detected as a single peak or missed; use the second derivative (SG with
deriv=2) or peak deconvolution (Gaussian/Lorentzian fitting) to resolve them
Related Tools
Use the Gaussian Peak Fit to fit explicit Gaussian models to detected peaks — extracting precise centers, widths, and areas with confidence intervals. Use the Lorentzian Peak Fit for NMR and Raman spectra where peaks follow Lorentzian lineshapes. Use the Savitzky-Golay Filter to smooth the signal before peak detection and to compute first/second derivatives for shoulder peak resolution. Use the Moving Median Filter to suppress spike outliers that would otherwise be falsely detected as peaks.
Frequently Asked Questions
What is the difference between height and prominence?Height is the absolute signal value at the peak top. Prominence is how much the peak stands out relative to its immediate surroundings — it equals the peak height minus the highest point in the valley between the peak and the nearest taller peak. Consider two peaks: a small spike of height 3.0 on top of a plateau at 2.8 (prominence = 0.2), and a smaller spike of height 2.0 on a flat baseline at 0.0 (prominence = 2.0). The first is nearly invisible as a "real" peak despite its higher absolute value; the second is a prominent isolated feature. Filtering by prominence > 0.5 catches the second and skips the first — the correct result for most applications.
How do I find the right threshold parameters?
Start with a prominence sweep: detect all peaks with no constraints, then plot a histogram of peak prominences. There is usually a clear gap between the broad low-prominence mass (noise peaks, shoulders) and the narrow high-prominence cluster (real peaks). Set the threshold just above the gap. For height, look at the noise floor in a signal-free region and set height to 3–5× the noise standard deviation. The distance parameter should be set to at least half the expected minimum spacing between real peaks in your data.
How do I compute peak areas for quantification? After detecting peaks, integrate the signal within each peak's left and right base boundaries. Ask the AI to "integrate the signal between the left and right base of each detected peak; subtract a linear baseline drawn between the base points; report peak area for each peak". For spectroscopy and chromatography, the area (not height) is proportional to concentration. For overlapping peaks, use Gaussian or Lorentzian deconvolution to separate the contributions before integrating.
My signal has peaks on a sloping baseline — how do I handle that? A sloping baseline inflates the height of peaks on the ascending side and deflates peaks on the descending side. Solutions: (1) baseline subtraction — ask the AI to fit a polynomial or spline baseline to the signal-free regions and subtract it before detection; (2) use prominence instead of height — prominence is self-referencing relative to local valleys, so it is less affected by global slope; (3) asymmetric least squares baseline — a standard method for spectral baseline correction. Ask the AI to "fit a polynomial baseline to the regions outside the peaks and subtract it before running peak detection".