Attribution Model Comparison
Compare first-touch, last-touch, linear, and time-decay attribution models online from Excel or CSV journey data with AI.
Or try with a sample dataset:
Preview
What Is Attribution Model Comparison?
Marketing attribution determines how conversion credit is distributed across the multiple touchpoints a customer encounters before converting — a paid search ad, an email, an organic blog post, a retargeting display ad. Because most customers interact with 3–7 touchpoints before purchasing, the choice of attribution model has a large effect on how each channel appears in marketing reports and, consequently, how marketing budgets are allocated. Attribution model comparison runs multiple models on the same conversion path data simultaneously, letting you see how credit shifts between channels depending on which model you apply — and revealing how budget decisions would change under each model.
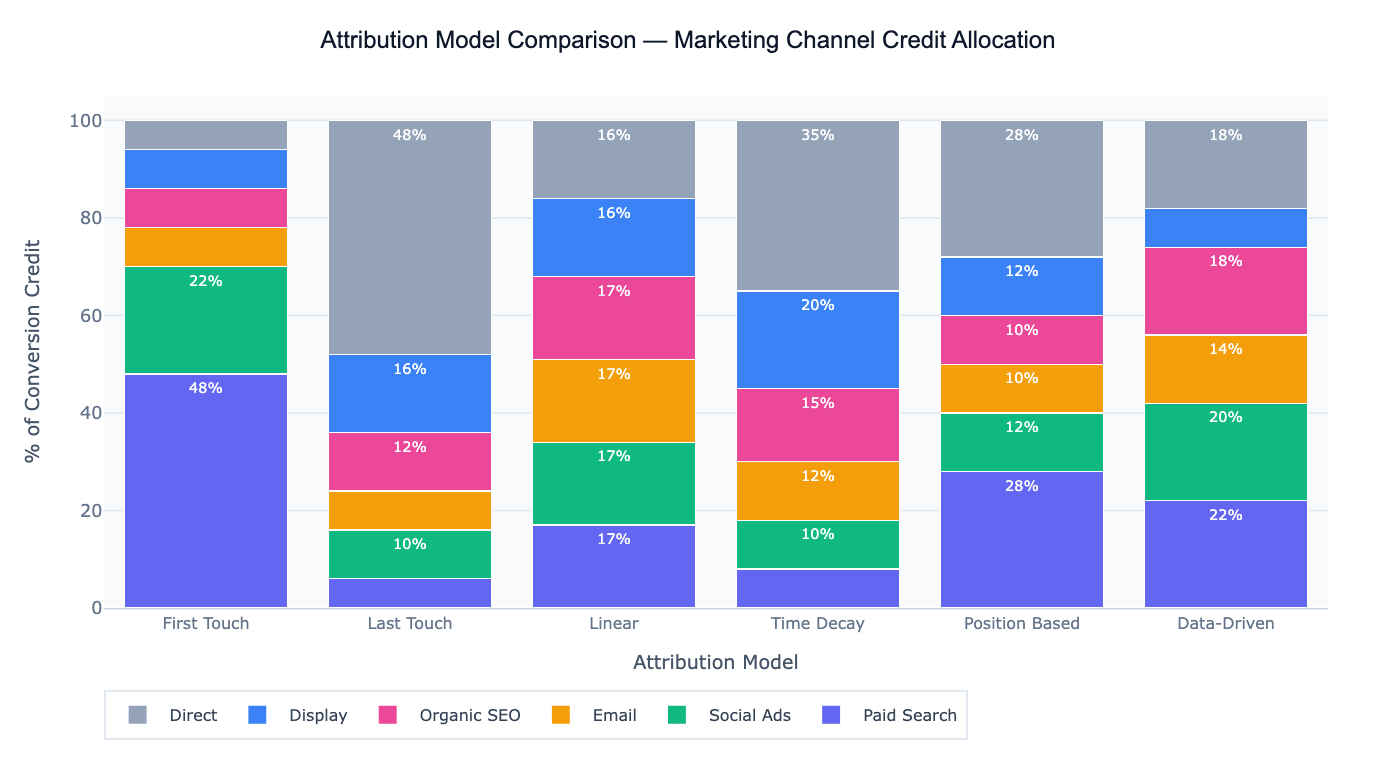
The five most common attribution models are: First-touch (100% credit to the first touchpoint — overvalues awareness channels like display and organic search, ignores closing channels); Last-touch (100% credit to the last touchpoint — overvalues bottom-funnel channels like branded paid search and email, ignores discovery channels); Linear (equal credit divided across all touchpoints — the simplest multi-touch model, treats every touchpoint identically regardless of position or timing); Time-decay (exponentially more credit to touchpoints closer to the conversion — appropriate when recency of engagement is a strong conversion signal); and Position-based (40% to first touch, 40% to last touch, 20% distributed equally across middle touches — balances discovery and closing channel credit). Data-driven attribution (available in Google Analytics 4 and some CDPs) uses machine learning on actual path data to estimate the true causal contribution of each channel, but requires large conversion volumes to be reliable.
A concrete example: an e-commerce company analyzes 2,400 converted customer journeys across 6 channels. Under last-touch, Paid Search receives 44% of conversion credit — because it frequently appears as the final click before purchase. Under linear attribution, Paid Search drops to 19%, while Display (which initiates 31% of journeys) rises from 8% to 22%. Organic SEO, which consistently appears mid-funnel, rises from 12% (last-touch) to 20% (linear). This analysis reveals that last-touch is systematically undercrediting awareness channels (Display, Organic SEO) and over-crediting closing channels (Paid Search, Email), leading to budget cuts in the channels that create demand.
How It Works
- Upload your data — provide a CSV or Excel file with one row per conversion path (e.g.,
customer_id,touchpoint_sequence,channel,timestamp,conversion_value) or one row per touchpoint with a path/session identifier. - Describe the comparison — e.g. "compare first-touch, last-touch, linear, and time-decay attribution; credit per channel under each model; bar chart; which channels gain/lose credit vs last-touch baseline"
- Get full results — the AI writes Python code using pandas and Plotly to reconstruct customer paths, compute channel credit under each attribution model, and produce the comparison chart and credit-shift table
Required Data Format
Option 1 — Path-level data (one row per conversion):
| Column | Description | Example |
|---|---|---|
customer_id | Unique customer identifier | C1234 |
path | Ordered channel sequence | Display > Email > Paid Search |
conversion_value | Revenue or conversion flag | 120.00, 1 |
Option 2 — Event-level data (one row per touchpoint):
| Column | Description | Example |
|---|---|---|
customer_id | Unique customer identifier | C1234 |
channel | Channel name | Paid Search, Email, Organic |
timestamp | Touchpoint datetime | 2024-03-15 14:32:00 |
converted | Whether this session led to conversion | 0, 1 |
conversion_value | Revenue at conversion | 0, 120.00 |
Any column names work — describe them in your prompt. For event-level data, the AI will reconstruct paths by grouping on customer_id and ordering by timestamp.
Interpreting the Results
| Output | What it means |
|---|---|
| Channel credit by model | % of total conversion credit allocated to each channel under each attribution model |
| Credit shift table | How much credit each channel gains or loses moving from last-touch to multi-touch models |
| ROAS by attribution model | Return on ad spend (revenue attributed / spend) per channel under each model — changes the efficiency ranking |
| Path length distribution | How many touchpoints a typical converting customer has — informs which model is most appropriate |
| Top converting paths | Most common channel sequences that lead to conversion — useful for understanding journey structure |
| First vs last channel frequency | Which channels most often initiate journeys (discovery) vs close them (conversion) |
| Model comparison chart | Stacked or grouped bar chart showing credit per channel across all models side-by-side |
Example Prompts
| Scenario | What to type |
|---|---|
| Model comparison | compare first-touch, last-touch, linear, and time-decay attribution; credit % per channel; grouped bar chart |
| Credit shift analysis | credit shift table: how does each channel's credit change from last-touch to linear attribution? |
| ROAS restatement | compute implied ROAS per channel under last-touch vs linear; which channels look better/worse under linear? |
| Path analysis | top 10 converting paths; frequency and average conversion value; which paths have highest value? |
| Position-based | 40/20/40 position-based attribution; compare to last-touch; identify channels undervalued by last-touch |
| Channel overlap | what % of conversions involve 2+ channels? what % are single-touch? |
| Time-decay parameter | time-decay with 7-day half-life vs 14-day half-life; how sensitive is channel credit to the decay rate? |
| Funnel stage mapping | map channels to funnel stage: which channels appear in top, middle, bottom of path most frequently? |
Assumptions to Check
- Path completeness — attribution models are only as good as the touchpoint data you have; if email opens or organic visits aren't tracked (no UTM parameters, no cookie), those touchpoints are invisible to the model and credit will be misdirected to the first or last tracked touchpoint instead
- Path window — the lookback window (30 days, 90 days) determines which touchpoints are included in the path; a 7-day window will miss the display impression from 3 weeks ago, making last-touch appear more important; specify your lookback window explicitly
- Cross-device paths — if a customer first sees an ad on mobile but converts on desktop, the path may appear as a single-touch desktop conversion; cross-device attribution requires identity resolution (login-based or probabilistic matching)
- Time-decay half-life — the time-decay model's results depend on the assumed half-life parameter (typically 7 days); a 3-day half-life heavily discounts anything before the final week, while a 30-day half-life is nearly linear; test multiple values
- Data-driven attribution volume requirement — Google's data-driven attribution requires at least 3,000 conversions per month and 300 ad interactions per conversion path; below this threshold, the algorithmic model is unreliable and a rule-based multi-touch model is more appropriate
Related Tools
Use the Conversion Funnel Analysis tool to understand how users move through each step of the conversion process before analyzing which channels contribute to each stage. Use the A/B Test Calculator to test whether a campaign change — informed by attribution insights — produced a statistically significant improvement in conversion rate. Use the CAC vs LTV Calculator to translate attribution-adjusted channel credit into cost-per-acquisition and lifetime value metrics, closing the loop between attribution analysis and unit economics. Use the Lead Scoring Model to score and prioritize leads arriving through different channels, complementing attribution by predicting which new leads are most likely to convert.
Frequently Asked Questions
Which attribution model should I use? There is no universally correct attribution model — the right choice depends on your sales cycle, channel mix, and business objective. For short-cycle, single-touchpoint purchases (e.g., impulse buys from a single ad), last-touch is often adequate. For multi-touch B2B or high-consideration purchases with 3+ touchpoints over weeks, last-touch systematically undervalues awareness and nurture channels — linear or position-based attribution gives a fairer picture. Position-based (40/20/40) is the most commonly recommended starting point for multi-channel marketers because it preserves credit for both the discovery and closing channels without requiring the statistical modeling of data-driven attribution. If you have high conversion volume (> 5,000/month), explore data-driven attribution.
Why do my paid search numbers drop so much under multi-touch attribution? Paid search — especially branded paid search — frequently appears as the last touchpoint before conversion because customers often search for a brand name just before purchasing. Under last-touch, this final click captures 100% of the credit even if the customer originally discovered the brand through a display ad or organic article weeks earlier. Under multi-touch models, paid search credit drops to reflect its actual role in the journey (typically a closing channel, not an initiating one). This does not mean paid search is less valuable — it still closes conversions — but its ROAS under last-touch was likely overstated. The practical implication is that display, email, and organic channels are probably more ROI-positive than last-touch reporting suggests.
What is the difference between attribution and incrementality? Attribution distributes credit for conversions that already happened across touchpoints in the observed path. Incrementality asks a different question: would this conversion have happened without this channel? A customer who was always going to buy (high purchase intent) might click a branded paid search ad as the final step — last-touch gives the ad full credit, but the conversion was not caused by the ad. Incrementality testing (randomized holdout experiments, geo-experiments) measures the causal lift from a channel by comparing conversion rates between exposed and unexposed groups. Attribution is easier to implement at scale; incrementality is more accurate but requires controlled experiments. The best practice is to use attribution for day-to-day optimization and incrementality tests to validate the most important budget allocation decisions.