CAC vs LTV Calculator
Calculate CAC, LTV, payback period, and LTV to CAC ratios online from Excel or CSV data with AI.
Or try with a sample dataset:
Preview
What Are CAC and LTV?
Customer Acquisition Cost (CAC) is the total sales and marketing spend required to acquire one new paying customer: CAC = Total Sales & Marketing Spend / Number of New Customers Acquired. Customer Lifetime Value (LTV) is the total net revenue a business expects to earn from a customer over their entire relationship: for a subscription business, LTV = (Average Revenue Per User × Gross Margin Percentage) / Monthly Churn Rate. The LTV:CAC ratio — the single most important unit economics metric for subscription and recurring-revenue businesses — measures how much value a customer generates relative to what it cost to acquire them. A ratio below 1:1 means you're losing money on every customer; the industry benchmark is a minimum of 3:1, and 5:1 or above is considered healthy.
The payback period — how many months of customer revenue it takes to recover the CAC — translates LTV:CAC into a cash flow constraint. A company with LTV:CAC = 4:1 but an 18-month payback period needs substantial working capital to fund growth, because it takes 18 months to recoup what it spent to acquire each customer. Growth-stage companies should track both: a high LTV:CAC with a long payback can still create cash flow problems. CAC by channel is particularly revealing — the aggregate CAC blends efficient channels (organic, referral) with expensive ones (events, paid social); disaggregating reveals where marketing dollars generate the best return and which channels to scale vs cut.
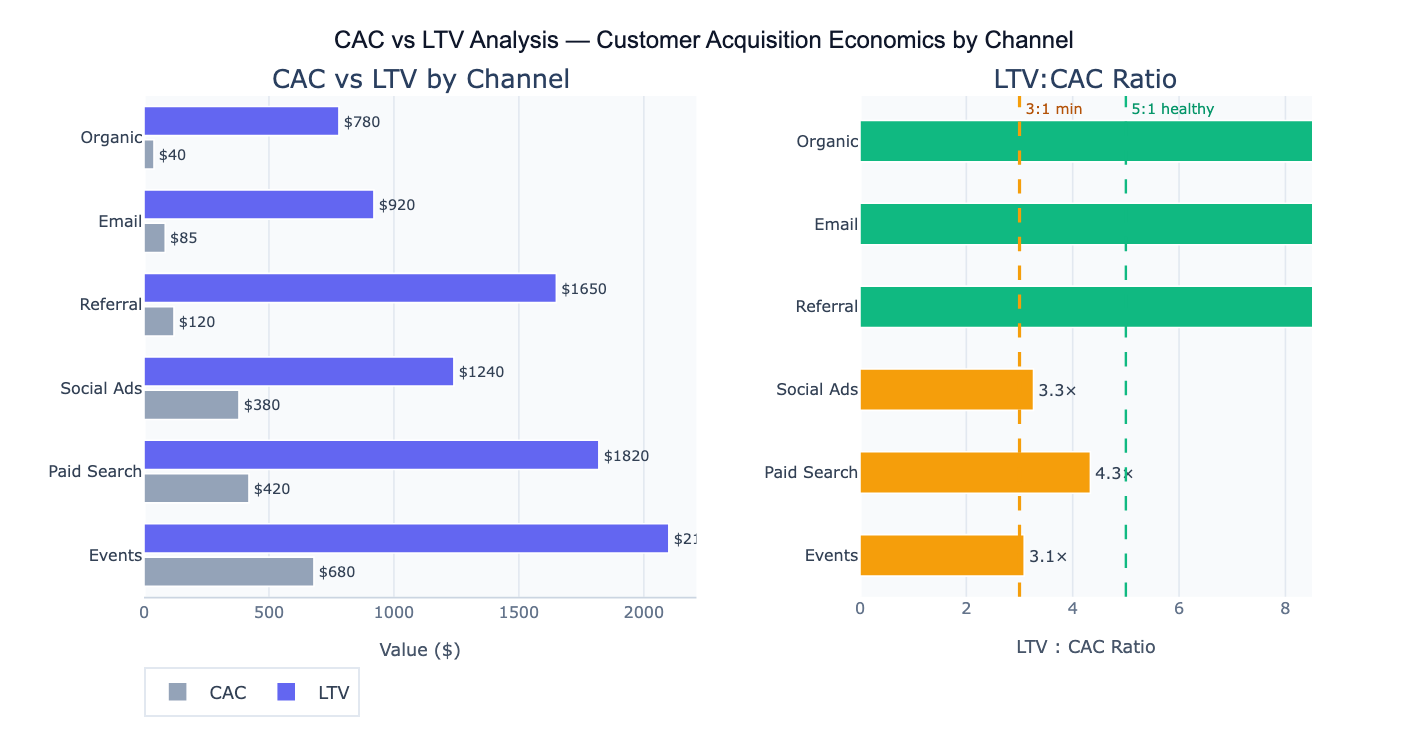
A concrete example: a B2B SaaS company analyzes 6 acquisition channels. Organic SEO has the lowest CAC (780, yielding an 19.5:1 ratio — but it's supply-constrained (can't be easily scaled). Events have the highest CAC (2,100), yielding a 3.1:1 ratio — barely above the minimum threshold and with a 15-month payback period. Paid Search (1,820 LTV, 4.3:1) is the most scalable efficient channel. This analysis directs marketing budget toward Paid Search and Referral (4.1:1) while reconsidering Events spend.
How It Works
- Upload your data — provide a CSV or Excel file with marketing spend by channel, new customer counts, and revenue data (either customer-level transaction history or aggregate metrics like average contract value and churn rate).
- Describe the calculation — e.g. "channels: Paid Search, Email, Organic; spend and new customers per channel; avg monthly revenue $120, gross margin 75%, monthly churn 4%; compute CAC, LTV, ratio, payback; bar chart"
- Get full results — the AI writes Python code using pandas and Plotly to compute CAC, LTV, LTV:CAC ratios, and payback periods, and generate the comparison charts
Required Data Format
Option 1 — Aggregate summary (most common):
| Column | Description | Example |
|---|---|---|
channel | Acquisition channel | Paid Search, Email |
spend | Total marketing spend in period | 42000, 8500 |
new_customers | New customers acquired | 100, 100 |
avg_monthly_revenue | Average MRR per customer | 120, 95 |
gross_margin_pct | Gross margin % | 0.75, 0.80 |
monthly_churn_rate | Monthly churn % | 0.04, 0.03 |
Option 2 — Customer-level transaction log: one row per transaction with customer_id, acquisition_channel, acquisition_cost, transaction_date, revenue. The AI will compute CAC and cumulative LTV from the transaction history.
Interpreting the Results
| Output | What it means |
|---|---|
| CAC | Total spend / new customers — cost to acquire one customer; lower is better given equal LTV |
| LTV | Expected revenue per customer over their lifetime — (ARPU × Margin) / Churn |
| LTV:CAC ratio | < 1 = losing money; 1–3 = marginal; 3–5 = healthy; > 5 = very efficient (possibly underinvesting in growth) |
| Payback period | Months until cumulative revenue per customer equals CAC — shorter = better cash efficiency |
| Gross margin-adjusted LTV | LTV computed on contribution margin, not revenue — the economically correct version |
| Channel efficiency rank | Channels ranked by LTV:CAC — shows where to increase vs reduce spend |
| Break-even month | First month where cumulative per-customer revenue exceeds CAC |
Example Prompts
| Scenario | What to type |
|---|---|
| Channel comparison | CAC and LTV per channel; LTV:CAC ratio; horizontal bar chart; flag below 3:1 |
| Payback period | months to payback per channel; bar chart sorted by payback; highlight channels > 12 months |
| Cohort LTV curves | cumulative LTV over 24 months for each acquisition cohort; line chart; mark CAC as horizontal line |
| Sensitivity analysis | if churn rate increases from 4% to 6%, how does LTV:CAC change for each channel? |
| Blended vs channel CAC | compare blended (total) CAC to channel-level CAC; which channels subsidize others? |
| Growth scenarios | if we double Paid Search spend, what incremental revenue do we expect assuming same CAC? |
| Segment LTV | LTV by customer segment (SMB, Enterprise); which segment has best unit economics? |
| Margin-adjusted LTV | recompute LTV using 70% gross margin instead of revenue; how does this change channel ranking? |
Assumptions to Check
- LTV formula assumptions — the simple LTV = (ARPU × Margin) / Churn formula assumes constant churn rate, constant revenue per user, and infinite time horizon; all three are simplifications; for early-stage companies with limited history, use observed 12-month or 24-month cumulative LTV rather than formula-based LTV
- Fully-loaded CAC — ensure CAC includes all sales and marketing costs: ad spend, agency fees, sales team salaries (prorated), onboarding costs, and any free trial costs; many companies undercount CAC by including only media spend, which makes unit economics look artificially healthy
- Attribution of marketing spend — when a customer is acquired through multiple touchpoints (e.g., organic SEO first, then paid retargeting), the CAC calculation depends on which channel gets credit; specify whether you're using first-touch, last-touch, or linear attribution
- Churn rate measurement — monthly churn rate has a large effect on LTV: 2% monthly churn implies LTV = 50 months of revenue, while 5% monthly churn implies only 20 months; ensure churn is measured as lost customers / active customers at start of period, not lost customers / total customers ever
Related Tools
Use the Cohort Retention Analysis tool to compute empirical LTV from actual customer revenue histories rather than relying on the formula-based estimate — cumulative cohort revenue at 12 and 24 months is the most reliable LTV estimate for data-rich companies. Use the Conversion Funnel Analysis to understand how efficiently each acquisition channel converts leads into paying customers — a low-CAC channel that has a 50% trial-to-paid conversion is more valuable than a similar channel with 20% conversion. Use the Sales Forecasting Tool to project future revenue based on expected new customer acquisition and churn, using LTV and CAC as inputs to the model.
Frequently Asked Questions
What is a good LTV:CAC ratio? The widely cited benchmark is 3:1 as a minimum for a sustainable subscription business. Below 3:1, customer revenue doesn't sufficiently exceed acquisition costs to cover overhead and generate profit at scale. Above 5:1 is generally good, but an unusually high ratio (> 10:1) may indicate underinvestment in growth — the company is leaving revenue on the table by not acquiring more customers with such efficient unit economics. For early-stage startups still finding product-market fit, 2:1 can be acceptable temporarily. For capital-efficient mature businesses, 4–6:1 is typical.
Why does my payback period matter if LTV:CAC is healthy? LTV:CAC tells you the total return on customer acquisition, but payback period tells you when that return materializes. A 4:1 LTV:CAC with an 18-month payback means you must finance 18 months of operations before each customer contributes net positive cash flow. If you're growing rapidly and acquiring thousands of customers per month, this creates a large cash flow deficit that must be funded by capital. A 4:1 LTV:CAC with a 6-month payback is dramatically better for cash efficiency — the company can self-fund growth much more easily. Fast-growing companies should target payback periods under 12 months for sustainable growth.
How should I compute LTV for a non-subscription business? For transaction-based businesses (e-commerce, marketplace, project-based services), LTV = Average Order Value × Purchase Frequency × Average Customer Lifespan (in years) × Gross Margin. Alternatively, use cohort analysis: track cumulative revenue per customer acquired in a given month over 12, 24, and 36 months, and use the observed curve to estimate LTV at a defined horizon (e.g., "24-month LTV"). The cohort approach is more accurate than the formula approach for businesses with irregular purchase patterns. For one-time purchase businesses (no repeat), LTV effectively equals the first-purchase margin minus CAC.