Mediation Analysis Calculator
Run mediation analysis online from Excel or CSV data. Estimate direct and indirect effects with bootstrap confidence intervals using AI.
Or try with a sample dataset:
Preview
What Is Mediation Analysis?
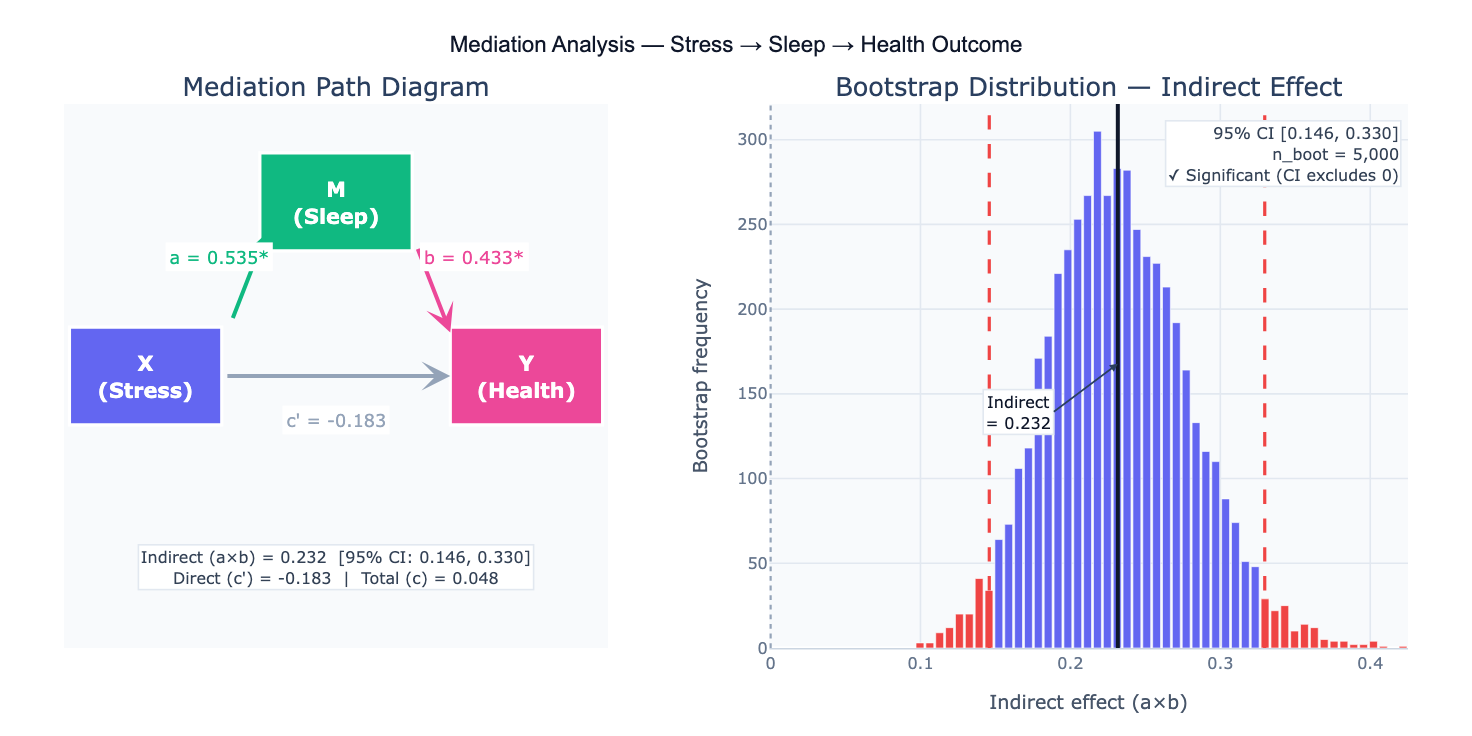
Mediation analysis tests whether the effect of an independent variable X on an outcome Y operates through an intermediate variable M (the mediator). Rather than simply asking "does X affect Y?", mediation asks "how does X affect Y — what is the mechanism?" The total effect of X on Y is decomposed into: the indirect effect (X → M → Y, the part that flows through the mediator) and the direct effect (X → Y after accounting for M). The indirect effect is quantified as the product of path a (X → M) and path b (M → Y controlling X), written as a×b. Complete mediation occurs when the direct effect (c') is zero after including the mediator — all of X's effect on Y goes through M. Partial mediation occurs when both the indirect and direct effects are significant.
The classic example from social psychology: socioeconomic status (X) predicts depression (Y). A mediation analysis reveals that SES affects depression largely through perceived stress (M) — lower SES → higher perceived stress → worse depression. The path coefficients show: a = −0.41 (lower SES → more stress), b = 0.52 (more stress → more depression), c' = −0.12 (small direct effect of SES on depression after controlling stress). The indirect effect a×b = −0.21 accounts for 64% of the total effect — stress mediates most of the SES-depression relationship.
Mediation analysis requires careful attention to causal inference. The path model implicitly assumes a causal ordering: X causes M, which causes Y, and there are no unmeasured confounders of the M → Y path. These are assumptions about the data-generating process that cannot be verified from the data alone — they must be justified by theory, temporal ordering, or experimental manipulation. Bootstrap resampling (rather than the older Sobel test) is the gold standard for testing the indirect effect because the sampling distribution of a×b is typically non-normal, and bootstrap confidence intervals correctly capture its asymmetry. The percentile bootstrap CI (5000+ resamples) is the recommended default; if the CI excludes zero, the indirect effect is statistically significant.
How It Works
- Upload your data — provide a CSV or Excel file with one column each for the predictor (X), mediator (M), and outcome (Y). Optional covariates can be included as additional columns to control for confounders.
- Describe the analysis — e.g. "X = stress_score, M = sleep_hours, Y = health_index; bootstrap indirect effect with 5000 samples; 95% percentile CI; path diagram; proportion of total effect mediated"
- Get full results — the AI writes Python code using statsmodels and Plotly to estimate path coefficients via OLS regression, run percentile bootstrap to obtain the indirect effect CI, and produce the path diagram and bootstrap distribution plot
Required Data Format
| Column | Description | Example |
|---|---|---|
X | Predictor / independent variable | stress_score, dose, SES |
M | Mediator variable | sleep_hours, cortisol, self_efficacy |
Y | Outcome / dependent variable | health_index, performance, depression |
covariate | Optional: control variables | age, sex, baseline |
Any column names work — describe them in your prompt. All variables should be numeric and continuous; for binary mediators or outcomes, mention that logistic regression should be used for the relevant path. With covariates, they are included as predictors in both the M and Y regressions.
Interpreting the Results
| Output | What it means |
|---|---|
| Path a | X → M coefficient — how strongly X predicts the mediator |
| Path b | M → Y coefficient (controlling X) — how strongly mediator predicts outcome |
| Direct effect (c') | X → Y coefficient after including M — X's effect not explained by M |
| Total effect (c) | X → Y without M in the model — c = c' + a×b |
| Indirect effect (a×b) | Effect of X on Y transmitted through M — the mediated portion |
| 95% Bootstrap CI | Percentile CI for indirect effect — excludes zero = significant mediation |
| Proportion mediated | a×b / c — fraction of total effect explained by the mediator; only meaningful when c and a×b have the same sign |
| Path diagram | Visual summary of all paths with coefficients; arrows show hypothesized causal flow |
Example Prompts
| Scenario | What to type |
|---|---|
| Basic mediation | X = stress, M = sleep, Y = health; bootstrap indirect effect 5000 reps; 95% CI; path diagram |
| With covariates | mediation with covariates age and sex; include in both M and Y regressions; report adjusted path coefficients |
| Multiple mediators | parallel mediation with 3 mediators (M1=sleep, M2=exercise, M3=diet); indirect effect for each; compare specific indirect effects |
| Serial mediation | serial mediation: X → M1 → M2 → Y; indirect effect through sequential chain; bootstrap CI |
| Proportion mediated | mediation analysis; report proportion of total effect mediated; test if direct effect becomes non-significant |
| Binary outcome | Y is binary (0/1); use logistic regression for Y path; odds-ratio scale indirect effect; bootstrap CI |
| Moderated mediation | test whether mediation effect varies by gender (moderator W); index of moderated mediation; conditional indirect effects |
| Sensitivity analysis | report E-value for indirect effect — minimum confounding strength needed to explain away the mediation |
Assumptions to Check
- Causal ordering — mediation assumes X temporally or causally precedes M, which precedes Y; this cannot be verified statistically and must be justified by theory, study design (e.g., X measured before M), or prior literature; cross-sectional data with simultaneous measurement of X, M, and Y makes causal mediation claims tenuous
- No unmeasured M → Y confounders — the key identifying assumption for the indirect effect is that there are no unmeasured variables that confound the M → Y relationship; include known confounders as covariates in the Y regression; the E-value (sensitivity analysis) quantifies how strong an unmeasured confounder would need to be to explain away the indirect effect
- No X → Y confounders — the total and direct effects assume no unmeasured confounders between X and Y; in observational data, include known confounders; in experimental data where X is randomized, this assumption is satisfied
- Linearity — OLS-based mediation assumes linear relationships among X, M, and Y; inspect scatterplots and residual plots; for non-linear relationships, consider log-transforming skewed variables or using polynomial terms
- No interaction between X and M — standard mediation assumes the effect of M on Y is the same at all levels of X (no X×M interaction); test by adding an X×M interaction term to the Y regression; if significant, use moderated mediation instead
Related Tools
Use the Multiple Regression calculator to estimate the individual regression paths (a, b, c, c') separately — mediation analysis is a structured combination of regression equations. Use the Partial Correlation Calculator to examine whether the X-Y correlation shrinks when M is controlled — a large drop in partial correlation is informal evidence of mediation (though not a substitute for bootstrapped indirect effects). Use the Linear Mixed Effects Model Calculator when data are clustered or longitudinal and mediation is tested in a multilevel context — standard mediation assumes independent observations. Use the Factor Analysis Calculator if the mediator is a latent construct measured by multiple items — latent variable mediation (SEM) handles measurement error in M that inflates direct effects and deflates indirect effects in manifest-variable mediation.
Frequently Asked Questions
Why should I use bootstrap confidence intervals instead of the Sobel test? The Sobel test approximates the sampling distribution of a×b as normal, which is only valid in large samples with symmetric distributions of the paths a and b. In practice, the distribution of a×b is often right-skewed (especially with small samples or strong effects), and the Sobel test is too conservative — it underestimates significance. The percentile bootstrap makes no distributional assumptions: it directly resamples the data thousands of times, recomputes a×b each time, and uses the 2.5th and 97.5th percentiles of this empirical distribution as the CI. Simulations consistently show that bootstrap CIs have better coverage (closer to the nominal 95%) than the Sobel test, especially with n < 200. Use 5000+ bootstrap resamples for stable CI estimates.
What is the difference between full and partial mediation?Full (complete) mediation occurs when the direct effect c' is not significantly different from zero after including M in the model — all of X's effect on Y is explained by the mediator. Partial mediation occurs when both the indirect effect (a×b) and the direct effect (c') are significant — M explains some but not all of X's effect on Y. Note that Baron and Kenny's (1986) requirement of a significant total effect c as a prerequisite for mediation is outdated — the modern approach (Preacher & Hayes, 2008) tests the indirect effect directly via bootstrap, and mediation can exist even when c is non-significant (this can happen when indirect and direct effects have opposite signs and cancel each other out, called inconsistent or suppressor mediation).
How many observations do I need for reliable mediation analysis?
Simulation studies suggest n ≥ 200 for stable bootstrap estimates of the indirect effect with typical effect sizes (a ≈ 0.3–0.5, b ≈ 0.3–0.5). With n < 100, bootstrap CIs are wide and often include zero even when true mediation exists — insufficient power to detect the indirect effect. The power to detect mediation depends on the product a×b, not just the individual paths: two weak paths (a = 0.20, b = 0.20) require n ≈ 500+ to reliably detect the indirect effect of 0.04. Use a power calculator for mediation (e.g., the pwr2ppl R package or Monte Carlo power analysis) when planning sample sizes. When n < 50 and mediation is the primary hypothesis, collect more data rather than relying on the bootstrap.
Can I run mediation with a binary X or Y? Yes, with modifications. If X is binary (e.g., treatment vs control), the standard OLS approach works fine — X is just treated as a 0/1 dummy variable. If Y is binary, use logistic regression for the Y path (b and c') and interpret the indirect effect on the log-odds scale; bootstrap the indirect effect as usual. If M is binary, use logistic regression for the M path (a) and express the indirect effect as the product of the log-odds ratio from path a and the OLS coefficient from path b — this is an approximation, and the fully causal interpretation requires additional assumptions. For binary M or Y, report the indirect effect on the standardized scale (using probit regression) or use the product of coefficients method with heteroscedasticity-robust standard errors.