Exploratory Factor Analysis Calculator
Run exploratory factor analysis online from Excel or CSV survey data. Extract latent factors, rotate loadings, and inspect scree plots with AI.
Or try with a sample dataset:
Preview
What Is Factor Analysis?
Exploratory factor analysis (EFA) is a statistical method for identifying the underlying latent factors (unobserved constructs) that explain the patterns of correlations among a set of observed variables. The core idea is that if a group of questionnaire items all measure the same latent construct — for example, anxiety — they will correlate with each other, and factor analysis will identify that shared variance as a distinct factor. Unlike observed variables, latent factors cannot be measured directly; they are inferred from the covariances of the items that load on them. EFA is the foundational technique in psychometrics, used to develop and validate scales for intelligence, personality, psychopathology, quality of life, customer satisfaction, and dozens of other constructs.
The factor model is: X = ΛF + ε, where X is the vector of observed variables, Λ is the matrix of factor loadings (the correlation between each variable and each factor), F is the vector of latent factors, and ε is item-specific residual variance (uniqueness). A factor loading of 0.70 means the item shares 49% of its variance (0.70² = 0.49) with that factor — this is the item's communality contribution from that factor. Items with loadings ≥ 0.40 on a factor are typically considered to define that factor; items with loadings ≥ 0.30 on multiple factors are considered cross-loaders and may cause interpretation problems.
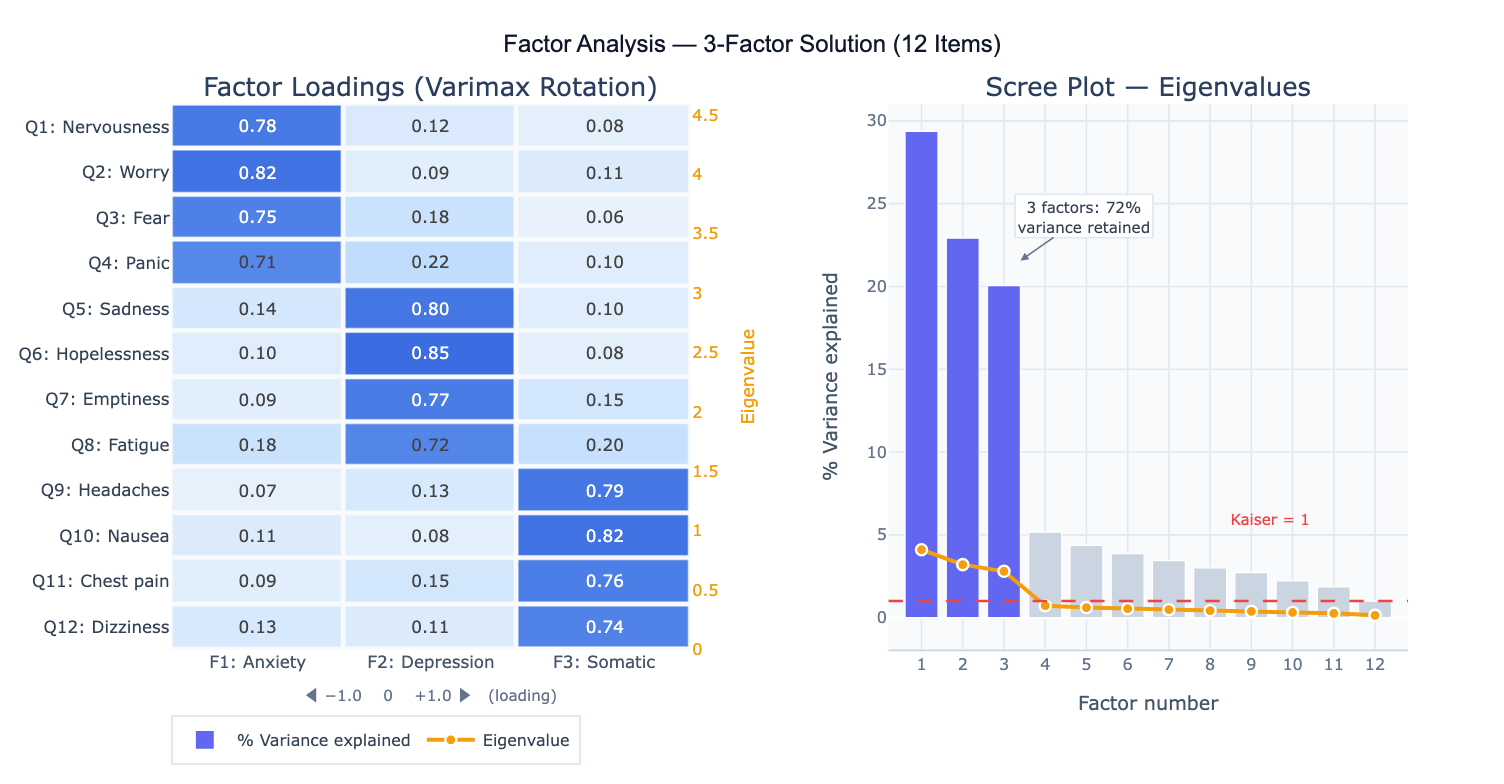
A practical example: a market researcher administers 15 customer satisfaction items to 400 customers. Factor analysis extracts 3 factors: Factor 1 loads heavily on items about product quality and reliability; Factor 2 loads on price and value items; Factor 3 loads on customer service and responsiveness items. The scree plot shows a clear "elbow" after factor 3, and together the three factors explain 68% of total item variance. After varimax rotation (which maximizes the simplicity of the loading pattern by making each variable load high on one factor and low on others), the factor structure is clean and interpretable — each item loads strongly on exactly one factor.
How It Works
- Upload your data — provide a CSV or Excel file with one column per variable (survey item, measurement, indicator) and one row per observation. All variables should be numeric. EFA works best with 5+ variables per expected factor and n ≥ 200 observations.
- Describe the analysis — e.g. "12-item anxiety/depression scale; extract factors using principal axis factoring; determine number via scree plot and parallel analysis; varimax rotation; factor loadings heatmap; report communalities and variance explained"
- Get full results — the AI writes Python code using factor_analyzer and Plotly to run EFA with your chosen extraction method and rotation, produce the factor loadings heatmap, scree plot, communality table, and optionally compute factor scores
Required Data Format
| Column | Description | Example |
|---|---|---|
Q1–Q12 | Item/variable responses | 1, 2, 3, 4, 5 (Likert scale) |
var1–varN | Any numeric variables | Continuous measurements, indicators |
id | Optional: respondent ID | R001, R002 |
Any column names work — describe them in your prompt. Variables should be on a common scale or be standardized. Missing values are excluded listwise by default. For ordinal Likert items (≤ 4 categories), specify that polychoric correlations should be used instead of Pearson.
Interpreting the Results
| Output | What it means |
|---|---|
| Factor loadings | Correlation between each variable and each factor — values ≥ 0.40 define the factor |
| Communality (h²) | Proportion of each variable's variance explained by all factors — low h² (<0.30) = item poorly explained |
| Eigenvalue | Variance extracted by each factor — Kaiser criterion: retain factors with eigenvalue > 1.0 |
| % Variance explained | Fraction of total variance captured by each factor — report cumulative % for retained factors |
| Scree plot | Eigenvalue vs factor number — retain factors above the "elbow" (point of inflection) |
| Rotated loading matrix | Loadings after rotation — simpler structure, easier to interpret |
| Factor correlation matrix | For oblique rotation: correlations between factors — high r suggests factors are not truly distinct |
| Factor scores | Each observation's estimated position on each latent factor — for downstream analysis |
Example Prompts
| Scenario | What to type |
|---|---|
| Basic EFA | extract factors using principal axis factoring; varimax rotation; scree plot; factor loadings heatmap; report communalities |
| Determine # factors | parallel analysis and scree plot to determine number of factors; compare Kaiser criterion vs parallel analysis recommendation |
| Oblique rotation | extract 3 factors with oblimin rotation (factors may be correlated); report pattern matrix and factor correlation matrix |
| Confirmatory check | EFA with 2-factor solution; compare fit to 1-factor and 3-factor solutions using RMSEA and CFI |
| Cross-loadings | identify items with loadings ≥ 0.30 on more than one factor; flag cross-loaders for review |
| Factor scores | extract 3 factors; compute factor scores for each respondent; scatter plot of factor 1 vs factor 2 scores colored by group |
| Scale validation | EFA then Cronbach's alpha for each extracted subscale; report factor structure and reliability together |
| Polychoric EFA | items are 4-point Likert scales; use polychoric correlations for EFA instead of Pearson; compare loading patterns |
Assumptions to Check
- Sample size — EFA requires at least n = 200 observations for stable results; n ≥ 300 is preferred; rules of thumb suggest 5–10 observations per variable; with small n, factor solutions are unstable and cross-validation on a holdout sample is essential
- Factorability of the correlation matrix — run Bartlett's test of sphericity (null: correlation matrix = identity; should be significant, p < 0.05) and Kaiser-Meyer-Olkin (KMO) measure (> 0.60 acceptable, > 0.80 good, > 0.90 excellent) before EFA; low KMO indicates the variables do not share enough common variance for factor analysis
- Linear relationships — EFA assumes linear relationships among variables; non-linear relationships (e.g. U-shaped item responses) will not be captured; inspect scatterplots of item pairs before running EFA
- No multicollinearity — items with near-perfect correlations (r > 0.90) cause matrix inversion problems; check for and remove or combine redundant items; conversely, items with r < 0.15 with all others are unlikely to load on any factor
- Rotation choice — use orthogonal rotation (varimax) when factors are expected to be uncorrelated (independent dimensions); use oblique rotation (oblimin, promax) when factors are expected to correlate (e.g., anxiety and depression subfactors of a general distress scale); always check the factor correlation matrix after oblique rotation — if all factor correlations are < 0.30, orthogonal rotation is appropriate
Related Tools
Use the PCA — Principal Component Analysis when you want to reduce dimensionality for visualization or downstream modeling rather than identify latent psychological constructs — PCA maximizes explained variance while EFA models the shared (common) variance structure. Use the Cronbach's Alpha Calculator to assess the internal consistency reliability of each subscale identified by factor analysis — EFA reveals the factor structure; Cronbach's alpha quantifies how reliably each factor is measured. Use the Correlation Matrix Calculator to inspect the raw inter-item correlations before EFA and verify that the matrix is factorable. Use the Partial Correlation Calculator to examine relationships between variables after controlling for the influence of extracted factors.
Frequently Asked Questions
What is the difference between exploratory and confirmatory factor analysis?Exploratory factor analysis (EFA) makes no prior assumptions about which variables load on which factors — it discovers the factor structure from the data. It is used in scale development to identify dimensions before a theory is fully formed. Confirmatory factor analysis (CFA) tests a specific pre-specified model (e.g., "items 1–4 load on Factor 1, items 5–8 on Factor 2") and reports fit statistics (RMSEA, CFI, SRMR) indicating how well the model fits the data. CFA requires structural equation modeling software (e.g., R's lavaan). The standard workflow in psychometrics is EFA on a development sample → CFA on an independent validation sample. Running CFA on the same data used for EFA is circular and will produce inflated fit statistics.
How do I decide how many factors to retain? Use multiple criteria and look for convergence: (1) Kaiser criterion — retain factors with eigenvalue > 1.0 (tends to over-extract); (2) Scree plot — retain factors above the point where the curve flattens (the "elbow"); (3) Parallel analysis — compare eigenvalues from your data to those from random data of the same size; retain factors whose eigenvalues exceed the random-data 95th percentile (most accurate method); (4) Interpretability — does each factor have a clear, coherent meaning? Can you name it? Solutions that are mathematically defensible but conceptually opaque should be reconsidered. If parallel analysis says 3 factors but only 2 are interpretable, report the 2-factor solution with justification.
What is varimax rotation and when should I use a different rotation?Varimax is an orthogonal rotation that maximizes the variance of squared loadings within each factor, pushing loadings toward 0 or ±1 and minimizing cross-loadings. It produces the simplest, most interpretable loading pattern when factors are truly independent. Use varimax for personality dimensions, cognitive abilities subtests, or any domain where independence between factors is theoretically expected. Use oblimin or promax (oblique rotations) when factors are expected to correlate — for example, anxiety and depression share substantial variance and their factors will be correlated even after rotation. The factor correlation matrix from an oblique rotation tells you whether you actually needed oblique rotation; if all factor correlations are small (< 0.20–0.30), varimax would have given similar results.
Why do my factor loadings change when I add or remove variables? Factor analysis is a data-driven technique — the extracted factors represent the common variance in the specific set of variables you include. Adding or removing variables changes the covariance structure and can alter both the number and interpretation of extracted factors. This is why EFA solutions from different studies rarely replicate perfectly: different item pools capture different aspects of a domain. This sensitivity to item selection is also why CFA on an independent sample is important — it tests whether the factor structure generalizes beyond the original development sample. Always report your exact item pool and sample characteristics so others can evaluate generalizability.