Partial Correlation Calculator for Excel & CSV
Calculate partial correlations online from Excel or CSV data. Control for confounders and isolate the relationship between variables with AI.
Or try with a sample dataset:
Preview
What Is Partial Correlation?
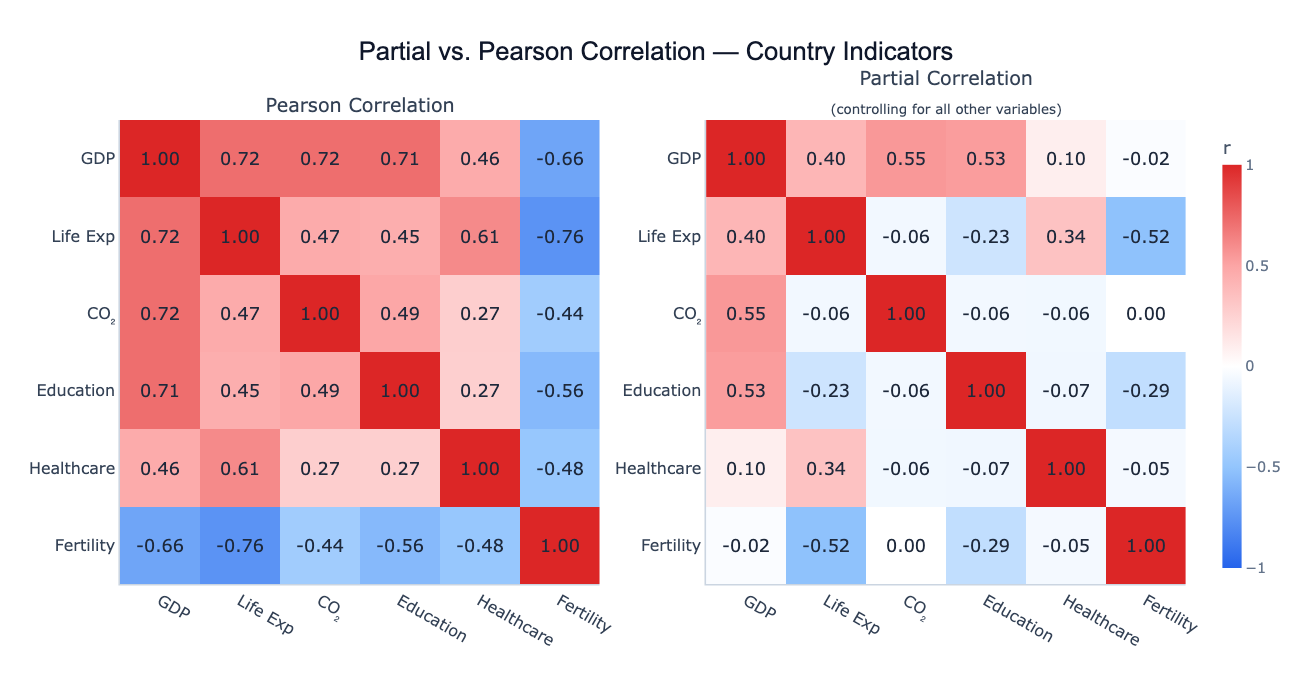
A partial correlation measures the relationship between two variables after removing the shared influence of one or more control variables. Where a standard Pearson correlation between X and Y captures everything that makes them move together — including any joint influence from a third variable Z — a partial correlation strips out Z's effect and shows only the direct linear relationship between X and Y that remains.
The classic example is the "ice cream and drowning" problem: ice cream sales and drowning deaths are strongly positively correlated (r ≈ 0.8), but this disappears almost entirely once you control for season (summer). Partial correlation of ice cream sales and drowning deaths, controlling for temperature, drops to near zero — revealing the original correlation as spurious, driven entirely by a shared confounder. In economics, CO₂ emissions and life expectancy are positively correlated across countries because both are driven by GDP; the partial correlation controlling for GDP can become negative, capturing the genuine health cost of pollution. In medicine, two biomarkers may correlate simply because both increase with age; partialling out age reveals whether they have a direct biological link.
Technically, partial correlation is computed from the precision matrix (inverse of the correlation matrix): the partial correlation between X and Y controlling for all other variables is −precisionX,Y / √(precisionX,X × precisionY,Y). Equivalently, it equals the correlation between the residuals from regressing X on all other variables and the residuals from regressing Y on all other variables. The result is a number between −1 and +1, interpreted like a standard correlation — but now it represents only the direct relationship, not the total association.
How It Works
- Upload your data — provide a CSV or Excel file with multiple numeric columns. One row per observation. The more control variables you include, the more confounding is removed.
- Describe the analysis — e.g. "partial correlation between CO₂ and life expectancy, controlling for GDP and education; compare with raw Pearson"
- Get full results — the AI writes Python code using pandas and numpy to invert the correlation matrix, compute partial correlations, and Plotly to render side-by-side comparison heatmaps
Interpreting the Results
| Output | What it means |
|---|---|
| Partial r near 0 (was large in Pearson) | The original correlation was spurious — driven by confounders |
| Partial r stays large | The relationship is direct — not explained by the control variables |
| Partial r flips sign | Confounders were masking or reversing the true direction of the relationship |
| Partial r larger than Pearson | Control variables were suppressing the true relationship (suppressor effect) |
| Pearson vs Partial comparison | Cells that change most between the two matrices are where confounding is strongest |
Example Prompts
| Scenario | What to type |
|---|---|
| Remove GDP confounder | partial correlations between health indicators controlling for log GDP per capita |
| Specific pair | partial correlation between CO2 and life expectancy controlling for GDP, education, and urbanization |
| Full matrix | partial correlation matrix of all numeric columns, compare side by side with Pearson |
| Medical | partial correlations between biomarkers controlling for age and sex; which remain significant? |
| Finance | partial correlations between asset returns controlling for market return (beta-adjusted) |
Assumptions to Check
- Multivariate normality — partial correlation via the precision matrix assumes the joint distribution is approximately multivariate normal; robust to mild violations with n > 50
- No perfect multicollinearity — the correlation matrix must be invertible; if two variables are perfectly correlated (r = 1.0), the precision matrix cannot be computed
- Sufficient sample size — reliable partial correlations require at least 20–30 observations per variable; with many control variables and small n, estimates become unstable
- Linear relationships — partial correlation captures only linear confounding; non-linear confounders require more complex methods
- Correct control set — you can only control for variables you include; unmeasured confounders still bias the partial correlations
Related Tools
Use the Correlation Matrix Calculator for standard Pearson or Spearman pairwise correlations without controlling for other variables — the starting point before deciding whether partial correlations are needed. Use the Multiple Regression tool for a full regression model that simultaneously controls for multiple predictors and gives coefficient estimates, standard errors, and p-values. Use the PCA tool to understand the shared variance structure before deciding which variables to use as controls.
Frequently Asked Questions
When should I use partial correlation instead of standard correlation? Use partial correlation whenever you suspect a confounding variable is driving the relationship you're studying. If GDP explains why CO₂ and life expectancy are correlated, partial correlation controlling for GDP reveals the direct link (if any). Common confounders to control for: age, sex, income level, geography, or time trends. If you're unsure, compare the Pearson and partial matrices — large differences indicate confounding is present.
What's the difference between partial correlation and multiple regression? Both control for confounders, but they answer different questions. Multiple regression gives a coefficient for each predictor — "holding other variables constant, how much does Y change per unit increase in X?" Partial correlation gives a standardized correlation between the residuals — "what fraction of the remaining variance in Y is linearly related to X, after removing all shared variance with other variables?" Partial correlations are symmetric (partial r of X|Y = partial r of Y|X), while regression slopes are not.
Can I compute partial correlations for a specific pair while only controlling for select variables? Yes — ask for "partial correlation between X and Y controlling only for Z" rather than all variables. This is called a first-order partial correlation (controlling for one variable) or k-th order partial correlation (controlling for k variables). The full precision matrix method controls for everything simultaneously.
My partial correlations are much larger than my Pearson correlations — what does that mean? This is a suppressor effect: one of the control variables was actively hiding a relationship that exists in the data. For example, if exercise and longevity are correlated but so are exercise and injury risk, controlling for injury risk might reveal a stronger direct longevity benefit from exercise. Suppressors are less common than confounders but provide important insight when they appear.
How do I compute p-values for partial correlations? The partial correlation coefficient follows a t-distribution with n − k − 2 degrees of freedom, where k is the number of control variables. Ask the AI to "add p-values and significance stars to the partial correlation matrix" — it will compute the t-statistic for each partial correlation and report significance at the 0.05, 0.01, and 0.001 levels.