Customer Segmentation Tool
Segment customers online from Excel or CSV data. Run RFM analysis, clustering, and profile high-value or at-risk groups with AI.
Or try with a sample dataset:
Preview
What Is Customer Segmentation?
Customer segmentation divides a customer base into distinct groups — segments — whose members share similar characteristics, behaviors, or needs. Rather than treating all customers identically, segmentation enables tailored strategies: different retention campaigns for at-risk customers, different upsell offers for champions, different reactivation messages for dormant accounts. The most widely used data-driven segmentation framework is RFM analysis: classifying customers by Recency (how recently they purchased), Frequency (how often they purchase), and Monetary value (how much they spend). These three dimensions capture the most predictive behavioral signals for customer lifetime value and churn risk without requiring complex modeling.
K-means clustering provides a complementary algorithmic approach when the segmentation dimensions extend beyond RFM or when you want the data to reveal its own natural groupings. K-means partitions customers into k clusters by minimizing within-cluster variance on the input features. The elbow method (plotting within-cluster sum of squares vs k) or silhouette score helps choose the optimal k. For datasets with many features, PCA (principal component analysis) reduces dimensionality before clustering, improving cluster separation and enabling 2D visualization where each point is a customer and its position reflects the two strongest axes of variation in the data.
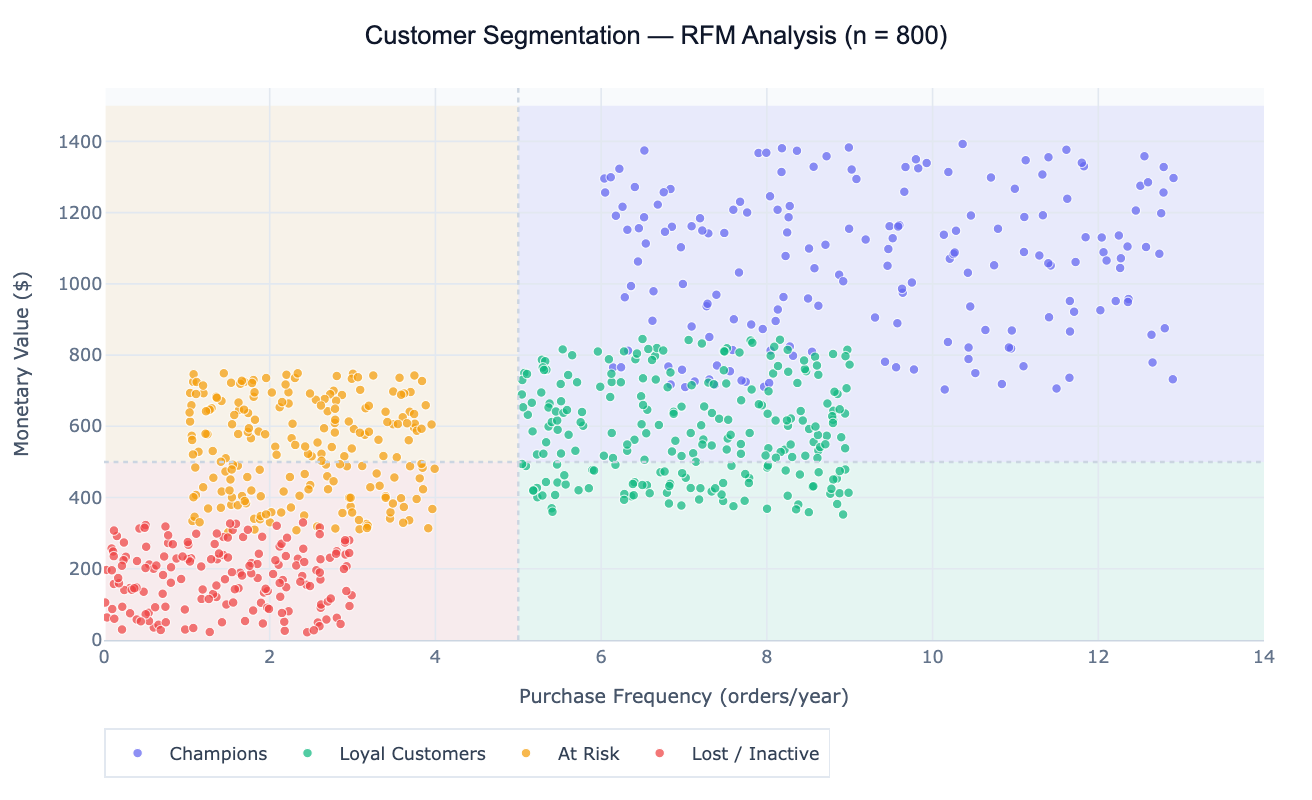
A concrete example: an e-commerce company applies RFM scoring to 800 customers. Champions (high R, F, M: 180 customers, 22% of base) generate 48% of revenue and have a 12-month retention rate of 91%. "At Risk" customers (low R, high F, M: 210 customers) have stopped purchasing recently despite historically high engagement — they are the highest-priority reactivation target. "Lost/Inactive" customers (low on all three: 170 customers) have not purchased in over 12 months and have low lifetime value; a lightweight win-back email costs little and reactivates ~5% of this group. The frequency vs monetary scatter plot clearly separates the four segments into distinct quadrants.
How It Works
- Upload your data — provide a CSV or Excel file with one row per customer and columns for purchase history metrics (recency, frequency, spend) or behavioral features (sessions, pages viewed, product categories browsed).
- Describe the segmentation — e.g. "RFM segmentation into 4 groups; scatter plot frequency vs monetary colored by segment; mean metrics per segment; identify Champions and At Risk customers"
- Get full results — the AI writes Python code using pandas, scikit-learn, and Plotly to score and segment customers, produce the scatter visualization with shaded quadrant regions, and compute per-segment summary statistics
Required Data Format
For RFM segmentation:
| Column | Description | Example |
|---|---|---|
customer_id | Unique identifier | C1234 |
recency_days | Days since last purchase | 12, 180, 420 |
frequency | Total number of orders | 8, 2, 45 |
monetary | Total spend | 1240, 89, 8500 |
For k-means / behavioral clustering:
| Column | Description | Example |
|---|---|---|
customer_id | Unique identifier | C1234 |
feature_1 … feature_n | Any numeric behavioral features | sessions, avg_order_value |
Alternatively, provide raw transaction-level data and ask the AI to compute RFM metrics per customer before segmenting.
Interpreting the Results
| Output | What it means |
|---|---|
| Segment assignment | Which segment each customer belongs to |
| Scatter plot | Customers plotted on two key dimensions; color = segment; shaded regions show quadrant boundaries |
| Segment size | Number and % of customers in each segment — informs campaign reach |
| Segment profiles | Mean recency, frequency, monetary (or feature means) per segment — characterizes each group |
| Revenue concentration | % of total revenue attributable to each segment — typically Champions generate 40–60% |
| RFM scores | 1–5 scores on each dimension; combined score drives segment assignment |
| Elbow/silhouette plot | For k-means: guides the choice of optimal number of clusters |
| PCA scatter | 2D projection of all features; each point = customer; cluster boundaries visible |
Example Prompts
| Scenario | What to type |
|---|---|
| RFM segmentation | RFM segmentation; score R, F, M 1–5; assign segments; scatter F vs M colored by segment; segment table |
| K-means clustering | k-means on 5 behavioral features; elbow method for optimal k; PCA scatter colored by cluster; cluster profiles |
| Segment revenue share | what % of revenue comes from each segment? bar chart of revenue by segment |
| At-risk identification | which customers moved from Champions to At Risk in the last 6 months? list them with their RFM scores |
| Segment over time | compute RFM segments for Q1 and Q2; how many customers migrated between segments? Sankey diagram |
| High-value threshold | what recency/frequency/spend thresholds define the top 20% of customers by LTV? |
| Churn prediction | which customers have not purchased in 90+ days but previously bought monthly? flag for reactivation |
| Geographic segments | compute RFM segments by region; compare segment distribution across regions; heatmap |
Assumptions to Check
- Data completeness — RFM analysis requires complete transaction history; if historical data is truncated (only last 12 months available but some customers were acquired 3 years ago), frequency and monetary scores will underestimate long-tenure customers; use a consistent observation window for all customers
- Scaling before clustering — k-means is sensitive to feature scale; always standardize (z-score) features before clustering so that a feature measured in dollars does not dominate features measured in sessions; describe whether to standardize
- Outlier customers — very high-spend or very high-frequency customers will distort k-means cluster centers; consider capping extreme outliers (e.g., at the 99th percentile) or treating them as a separate "VIP" segment before running clustering
- Segment stability — k-means clusters are sensitive to initialization and can vary between runs; run multiple initializations (k-means++) to ensure stability; verify that the segment profiles are interpretable and consistent before acting on them
- RFM score cut-points — quintile-based RFM scoring (top 20% = 5) is robust but can create arbitrary boundaries; customers just above or below a quintile boundary are nearly identical but receive different scores; consider using percentile ranges or fuzzy membership
Related Tools
Use the Cohort Retention Analysis tool to track how segment membership evolves over time — do Champions retain at 90% per month while At Risk customers churn at 30%? Use the Lead Scoring Model to score new prospects (before their first purchase) based on acquisition channel and initial behavior, analogous to the way RFM scores existing customers. Use the PCA — Principal Component Analysis tool to reduce high-dimensional customer feature sets before clustering — PCA identifies the most informative axes of variation for visualization. Use the A/B Test Calculator to test whether a targeted campaign sent to an "At Risk" segment significantly improved re-purchase rates compared to a control group.
Frequently Asked Questions
How many segments should I create? For RFM-based segmentation, 4–6 actionable segments is the practical sweet spot — enough to differentiate strategies (Champions vs Loyal vs At Risk vs Lost) without creating so many segments that marketing cannot act on each one differently. For k-means, let the elbow method guide k, but validate that each cluster has a distinct, interpretable profile and sufficient size to be actionable (at least 5% of the customer base). A common mistake is over-segmenting: 12 clusters where only 3–4 have meaningfully different profiles add complexity without insight.
What is the difference between RFM segmentation and k-means clustering?RFM uses expert-defined rules (score recency, frequency, and monetary on 1–5 scales, then assign named segments by score combinations) — it is interpretable, deterministic, and produces segments with clear business meaning. K-means is data-driven — it finds the natural clusters in whatever features you provide, without requiring prior knowledge of what the segments should look like. RFM is better when you have a clear framework and want predictable, stable segments. K-means is better when you have many features beyond R/F/M and want the data to reveal unexpected groupings. In practice, RFM is most common for retention marketing; k-means is used for product personalization or when behavioral features are richer.
My Champions segment is tiny (< 5% of customers) — is that normal? Yes — RFM Champions (high on all three dimensions) typically represent 10–25% of customers but generate a disproportionate share of revenue (40–60%). If your Champions segment is very small, check the quintile cut-points: are they too strict? Consider using top-30% thresholds instead of top-20%. If truly only 2–3% of customers qualify as Champions, it may reflect a business model with low repeat purchase rates (one-time buyers) where frequency and recency scores are uniformly low — in which case, segment primarily on monetary value and recency rather than frequency.