Z-Score Calculator for Excel, CSV, or Typed Values
Calculate z-scores online from Excel, CSV, or manual values. Standardize observations, flag outliers, and compare to percentiles with AI.
Or try with a sample dataset:
Preview
What Is a Z-Score?
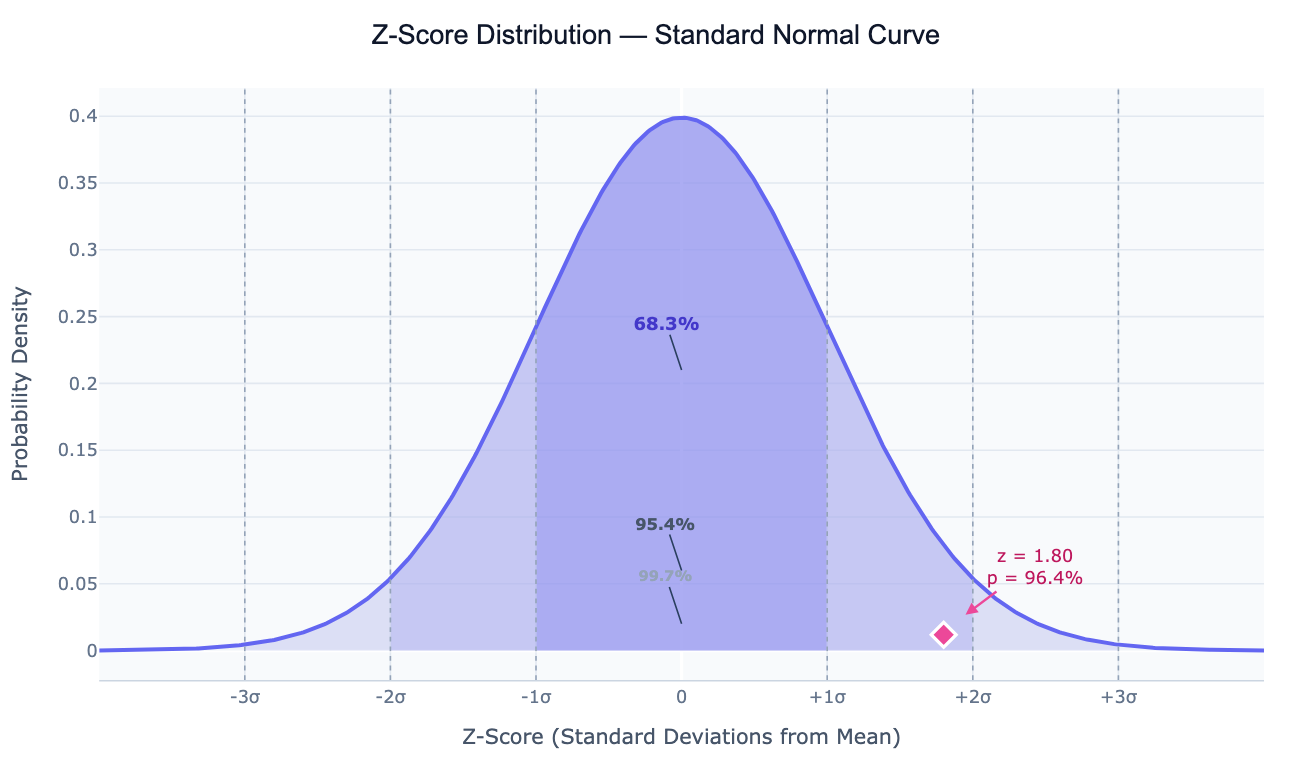
A z-score (also called a standard score) measures how many standard deviations a data point is from the mean of its distribution. The formula is simple: z = (x − μ) / σ, where x is the observation, μ is the mean, and σ is the standard deviation. A z-score of 0 means the value is exactly average; a z-score of +2 means the value is 2 standard deviations above average; a z-score of −1.5 means 1.5 standard deviations below.
The power of z-scores is standardization — they let you compare values that come from different scales or distributions. A student who scored 85 on a history test (mean 70, std 10) has z = +1.5. Another student who scored 620 on a math exam (mean 500, std 100) also has z = +1.2. Without z-scores, comparing 85 to 620 is meaningless; with z-scores, you can see the history student performed relatively better. This cross-scale comparison is used everywhere: standardizing biomarker levels before combining them into a risk score, comparing country performance across indicators with different units, and scaling features before machine learning.
Z-scores also directly encode percentile rank when the data is approximately normally distributed. A z-score of +1 corresponds to roughly the 84th percentile; +2 is the 97.7th percentile; −2 is the 2.3rd. This makes z-scores the standard tool for outlier detection: observations with |z| > 2 are in the outer 5% of the distribution, and |z| > 3 are in the outer 0.3% — typically flagged as potential outliers worth investigating.
How It Works
- Upload your data — provide a CSV or Excel file with one or more numeric columns. One row per observation.
- Describe what you want — e.g. "compute z-scores for GDP per capita, flag |z| > 2 as outliers, show the distribution"
- Get full results — the AI writes Python code using pandas and scipy to compute z-scores, percentiles, and outlier flags, and Plotly to visualize the distribution
Interpreting the Results
| Output | What it means |
|---|---|
| z = 0 | Value equals the mean of the distribution |
| z = +1 | Value is 1 standard deviation above the mean (~84th percentile) |
| z = −1 | Value is 1 standard deviation below the mean (~16th percentile) |
| z = +2 | ~97.7th percentile — top 2.3% of the distribution |
| z = −2 | ~2.3rd percentile — bottom 2.3% |
| |z| > 2 | Potential outlier — outside the central 95.4% of a normal distribution |
| |z| > 3 | Strong outlier — outside the central 99.7% |
| Percentile | % of observations that fall below this value |
Example Prompts
| Scenario | What to type |
|---|---|
| Outlier detection | `compute z-scores for all columns, flag observations with |
| Standardize for comparison | z-score normalize all numeric columns so they're on the same scale for comparison |
| Within-group z-scores | compute z-scores within each country group so values are relative to regional mean |
| Percentile ranking | compute z-scores and percentile ranks for exam scores, show normal curve with each student marked |
| Single value lookup | what is the z-score and percentile for a value of 85 in a distribution with mean 72 and std 9? |
Related Tools
Use the Exploratory Data Analysis tool for a full distributional summary including z-scores, outlier flags, skewness, and kurtosis across all columns at once. Use the Q-Q Plot Generator to check whether the distribution of z-scores is truly normal before relying on normal-distribution percentile tables. Use the Online t-test calculator when you want to formally test whether the mean of a sample differs from a known population mean, using the z-score logic extended to sample statistics.
Frequently Asked Questions
Can I compute z-scores without uploading data — just a single value? Yes — describe the calculation in text: "what is the z-score for x=92, mean=78, std=11?" The AI will compute the z-score, the corresponding percentile, and explain what it means. You can also ask "what value corresponds to the 90th percentile if mean=78 and std=11?" to work backwards from a percentile.
My data is skewed — are z-scores still valid? Z-scores can always be computed, but the percentile interpretation assumes approximate normality. For heavily skewed data (like income or CO₂ emissions), ask the AI to compute z-scores on the log-transformed values instead, which are usually much closer to normal. Alternatively, use modified z-scores based on the median and MAD (median absolute deviation) instead of mean and standard deviation — these are more robust to outliers.
What's the difference between a z-score and a t-score? A z-score uses the population standard deviation σ and is appropriate when σ is known or the sample is very large (n > 30). A t-score uses the sample standard deviation s and a t-distribution with n−1 degrees of freedom — appropriate for small samples where σ is estimated. For standardizing data points within a dataset, z-scores are standard. For hypothesis testing with small samples, use t-scores.
Can I z-score within groups rather than the whole dataset? Yes — ask for "z-scores within each department" or "standardize within each country group". This produces group-relative z-scores, which answer "how extreme is this value compared to its own group?" rather than the whole dataset. This is useful when groups have different baselines and you want to compare within-group standing.
How do I use z-scores to combine multiple indicators into a composite score? Compute z-scores for each indicator column (so they're all on the same scale), then average or weight the z-scores. Ask: "z-score normalize GDP, life expectancy, and education index, then compute a composite score as the average z-score per country". This is the basis of many human development and country ranking indices.