Violin Plot Generator for Excel & CSV
Create violin plots online from Excel and CSV data. Compare distributions, density, and group differences with AI.
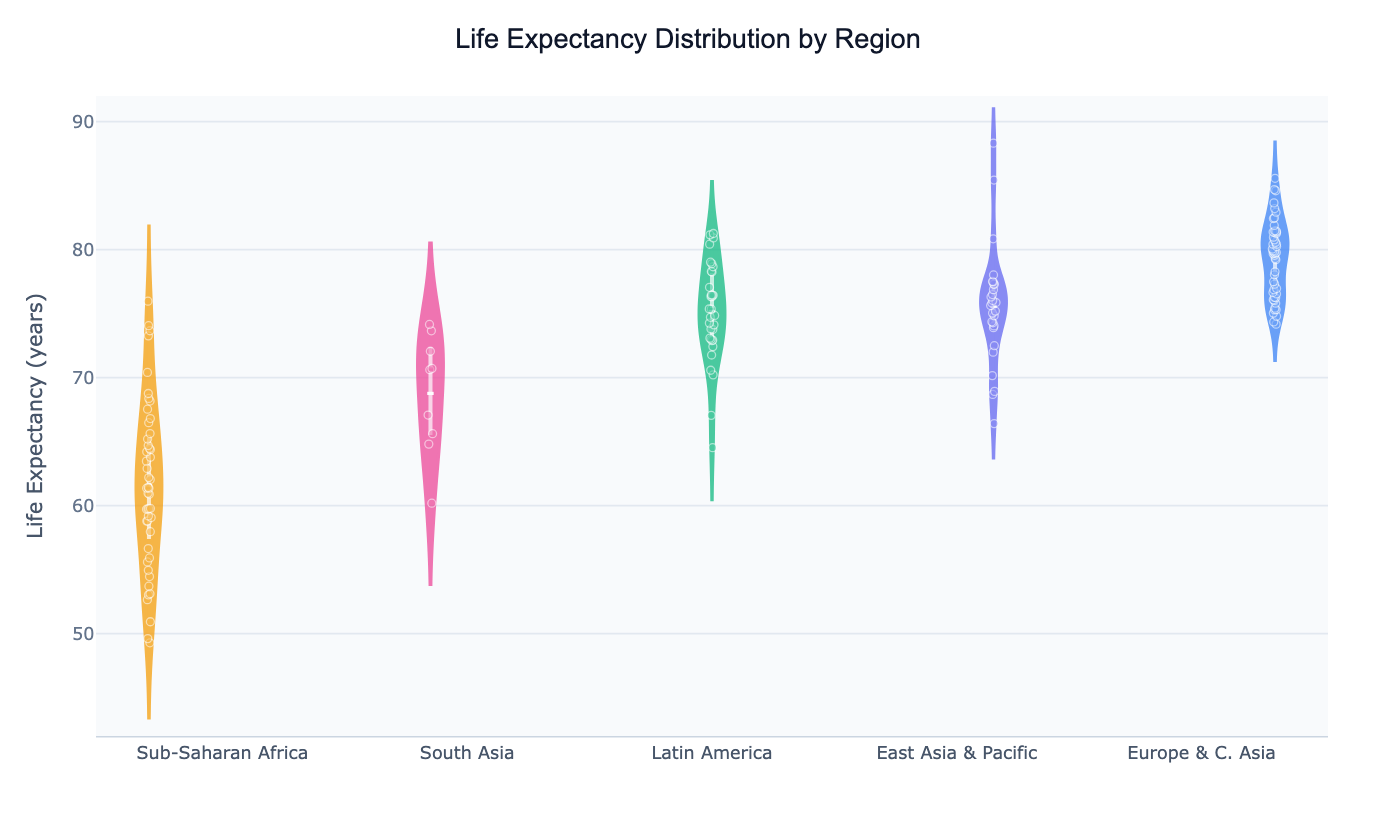
Or try with a sample dataset:
Preview
What Is a Violin Plot?
A violin plot is a chart that combines a box plot and a kernel density estimate (KDE) into a single shape. The width of the violin at any point represents how many data values fall near that level — a wide section means many observations there, a narrow pinch means few. This lets you see not just the median and spread, but the full shape of the distribution: whether it is unimodal, bimodal, skewed, or uniform.
Violin plots shine when comparing distributions across groups. A box plot tells you the median and quartiles of each group; a violin plot tells you much more — for example, whether one group has a bimodal distribution (two clusters of values) that a box plot would hide entirely. They are widely used in biology (gene expression across cell types), economics (income by country group), social science (test scores by demographic), and clinical research (biomarker levels by treatment arm).
The embedded box inside the violin shows the interquartile range (IQR) and median. Individual data points can be overlaid as a strip or jittered scatter, which is especially valuable for small samples where the KDE estimate can be misleading.
How It Works
- Upload your data — provide a CSV or Excel file with at least one numeric column and one categorical column to group by (e.g.
country,region,group,category) - Describe the plot — e.g. "violin plot of exam scores by school, show individual points and the mean line"
- Get the visualization — the AI writes Python code using Plotly or seaborn to build and style the chart
Interpreting the Results
| Visual element | What it means |
|---|---|
| Width of violin | Density of observations at that value — wider = more data points near that level |
| White dot / line inside box | Median |
| Box (IQR) | Middle 50% of data (25th to 75th percentile) |
| Thin vertical line (whiskers) | Range excluding outliers (typically 1.5× IQR) |
| Scattered points | Individual observations — useful for small samples |
| Flat top or bottom | Hard boundary in the data (e.g. a scale capped at 0 or 100) |
| Two bumps (bimodal) | Two distinct sub-populations within the group |
Example Prompts
| Scenario | What to type |
|---|---|
| Compare salary distributions | violin plot of annual salary by department, show all data points |
| Clinical trial outcome | violin plot of blood pressure reduction by treatment group, overlay individual patients |
| Academic performance | violin plot of test scores by grade level, color by school type |
| Country health metrics | violin plot of life expectancy by world_region, log scale, show median |
| Gene expression | half violin plot of expression levels by cell type, mirror box plot on the right |
Violin vs. Box Plot vs. Histogram
| Chart | Best for |
|---|---|
| Box plot | Comparing many groups quickly; outlier detection |
| Histogram | Showing one group's distribution in detail |
| Violin plot | Comparing distribution shape across a small number of groups (2–8) |
Use a violin plot when you suspect groups differ not just in median but in shape — for example, one group is bimodal or heavily skewed. For more than ~10 groups, a ridgeline plot or faceted histogram is often cleaner.
Related Tools
Use the Online t-test calculator or ANOVA calculator after visually exploring distributions with a violin plot — they'll test whether the differences you see are statistically significant. Use the AI Histogram Generator to examine a single group's distribution in more detail.
Frequently Asked Questions
My violin has a strange flat edge at the top or bottom — is that a bug?
No. Plotly and seaborn by default clip the KDE at the data's min/max, which creates a flat edge. You can ask the AI to use cut=0 (seaborn) or spanmode='hard' (Plotly) to enforce this, or cut=2 to extend the tails smoothly.
Can I show half-violins to save space? Yes — ask for a "half violin" or "split violin" plot. Split violins are especially useful for comparing two sub-groups (e.g. male vs. female) within each category by mirroring the two halves.
The violin for one of my groups looks like a thin line — why?
That group likely has very few data points or very low variance, so the KDE collapses. Ask the AI to overlay the raw points for that group, or increase the KDE bandwidth (bw_method in seaborn).
What's the difference between a violin plot and a ridgeline plot? A ridgeline (joy) plot stacks KDE curves vertically and works better when you have many groups (10+). A violin plot mirrors the KDE and is better for direct side-by-side comparison of a smaller number of groups.