Volcano Plot Generator for RNA-seq and Omics Data
Create volcano plots online from differential expression or screening results. Highlight fold change, significance, and top hits with AI.
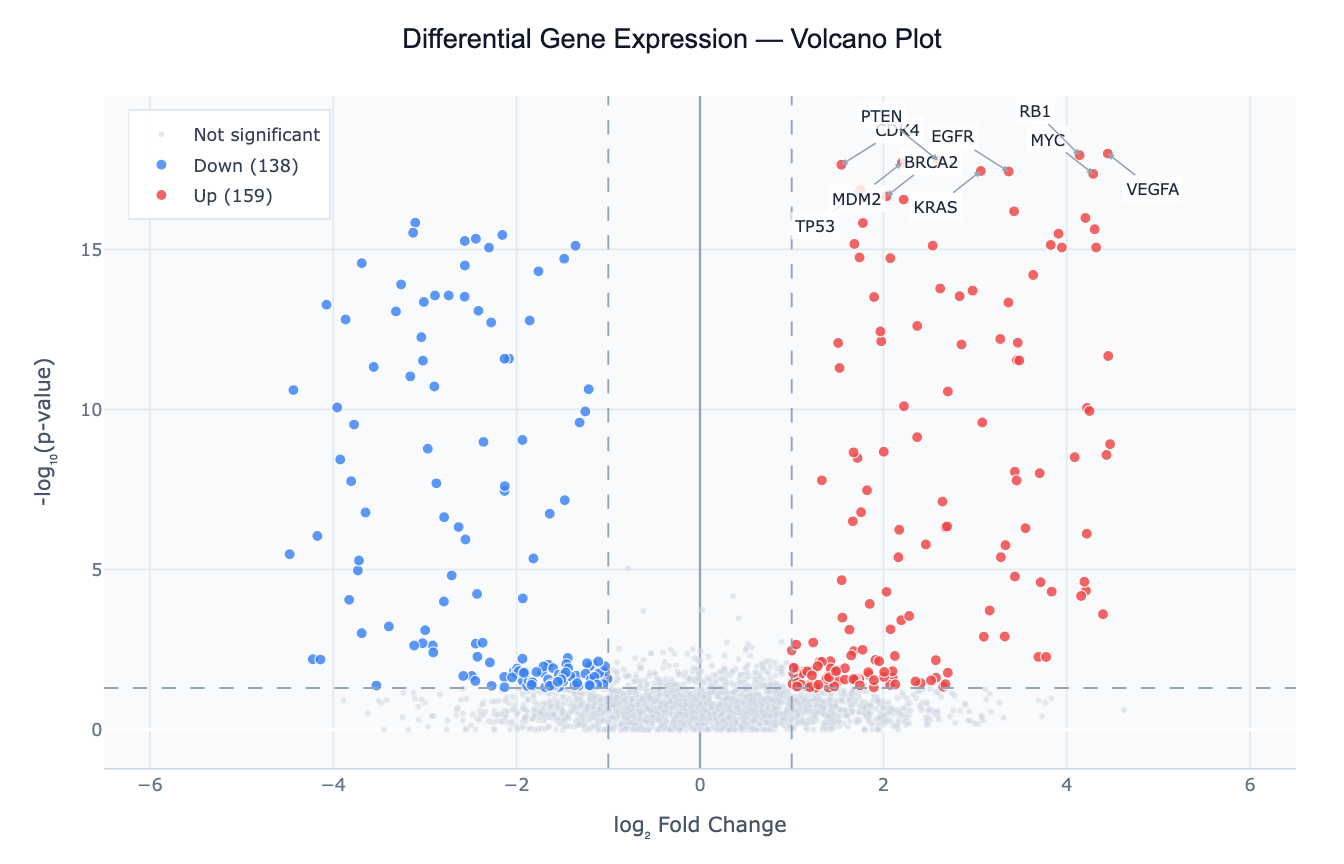
Or try with a sample dataset:
Preview
What Is a Volcano Plot?
A volcano plot is a scatter plot designed to simultaneously display the statistical significance and magnitude of change for a large number of features — typically genes, proteins, or genetic variants. The x-axis shows the log₂ fold change (how much a feature increases or decreases between two conditions), and the y-axis shows −log₁₀(p-value) (flipping the p-value scale so that more significant results appear higher up). The result looks like a volcanic eruption: a dense cloud of uninteresting features at the bottom center, with significant hits "erupting" upward at the left and right edges.
The chart's strength is its ability to show thousands of features at once while making the important ones immediately obvious. A gene that appears in the upper-right corner is both strongly upregulated (large positive fold change) and highly statistically significant (tiny p-value) — the ideal combination. Upper-left means strongly downregulated and significant. Features near the bottom or center are either not significant, not changed, or both.
Volcano plots originated in genomics but apply to any setting where you compare two groups across many features simultaneously: proteomics (treatment vs control protein abundance), GWAS (genetic variant association across the genome), metabolomics, or even large-scale A/B testing (many metrics compared at once across two cohorts).
How It Works
- Upload your data — provide a CSV or Excel file with at least three columns: a feature identifier (gene name, protein ID, SNP rsID), a log₂ fold change, and a p-value (raw or adjusted). This is the standard output format from DESeq2, edgeR, limma, or any differential analysis tool.
- Describe the plot — e.g. "volcano plot with |log2FC| > 1 and padj < 0.05 thresholds, label the top 20 genes by significance, color upregulated red and downregulated blue"
- Get the visualization — the AI generates Python code using Plotly to render the plot with threshold lines, color-coded points, and gene labels
Required Data Format
| Column | Description | Example values |
|---|---|---|
gene / feature | Feature identifier | BRCA2, TP53, rs12345 |
log2FoldChange | log₂(condition A / condition B) | -3.2, 0.1, 4.7 |
pvalue or padj | Raw or adjusted p-value | 0.0001, 0.32, 8.2e-15 |
Column names are flexible — describe them in your prompt if they differ (e.g. "the fold change column is called 'FC' and p-value is 'p.adj'").
Interpreting the Results
| Position on plot | What it means |
|---|---|
| Upper right | Significantly upregulated — high fold change + low p-value |
| Upper left | Significantly downregulated — large negative fold change + low p-value |
| Lower center | Not significant — close to baseline, high p-value |
| Right/left, bottom | Large fold change but not statistically significant (possibly low power) |
| Top center | Highly significant but small effect size (common with very large samples) |
Key Thresholds
| Threshold | Typical default | What it means |
|---|---|---|
| |log₂FC| > 1 | 2-fold change | Feature doubled or halved between conditions |
| p-value < 0.05 | −log₁₀p > 1.3 | 5% false positive rate (unadjusted) |
| padj < 0.05 | Stricter | Benjamini-Hochberg adjusted; accounts for multiple testing |
| |log₂FC| > 1.5 | More stringent | ~2.8-fold change; reduces false positives |
Always prefer adjusted p-values (padj, FDR) over raw p-values when available — raw p-values will produce many false positives across thousands of comparisons.
Example Prompts
| Scenario | What to type |
|---|---|
| Standard DE analysis | volcano plot, log2FC threshold 1, padj < 0.05, label top 15 genes by significance |
| Strict thresholds | `volcano plot with |
| Custom colors | volcano plot, upregulated in orange, downregulated in teal, grey for non-significant |
| Add gene counts | volcano plot with count labels in each quadrant showing how many genes are up/down/NS |
| GWAS style | volcano plot using p-value column, color hits above genome-wide significance (5e-8) in red |
Related Tools
Use the AI Heatmap Generator to visualise expression levels of your significant hits across all samples after identifying them with a volcano plot. Use the Exploratory Data Analysis tool to get summary statistics and distributions of your fold change and p-value columns before plotting.
Frequently Asked Questions
Some of my p-values are exactly 0 — what happens? A p-value of 0 usually means it underflowed floating point precision (the true value is smaller than ~1e-300). The AI will automatically replace zeros with a small floor value (e.g. 1e-300) before applying −log₁₀ so these points still plot at the top of the chart.
Should I use raw p-values or adjusted p-values? Always use adjusted p-values (padj, FDR, BH-corrected) when available. Raw p-values across thousands of genes will produce many false positives. If your data only has raw p-values, mention this in your prompt and the AI can apply Benjamini-Hochberg correction for you.
My gene labels are overlapping — how do I fix it?
Ask for "non-overlapping labels" or "label only the top N genes". The AI can use adjustText (matplotlib) or reduce the number of labeled points to avoid overlap.
Can I highlight a specific list of genes? Yes — paste the gene names directly into your prompt: "highlight these genes in purple: BRCA1, TP53, EGFR, MYC". The AI will color and label exactly those points regardless of their significance threshold.