Fisher's Exact Test Calculator
Run Fisher's exact test online from cell counts or a 2x2 table. Calculate exact p-values, odds ratios, and confidence intervals with AI.
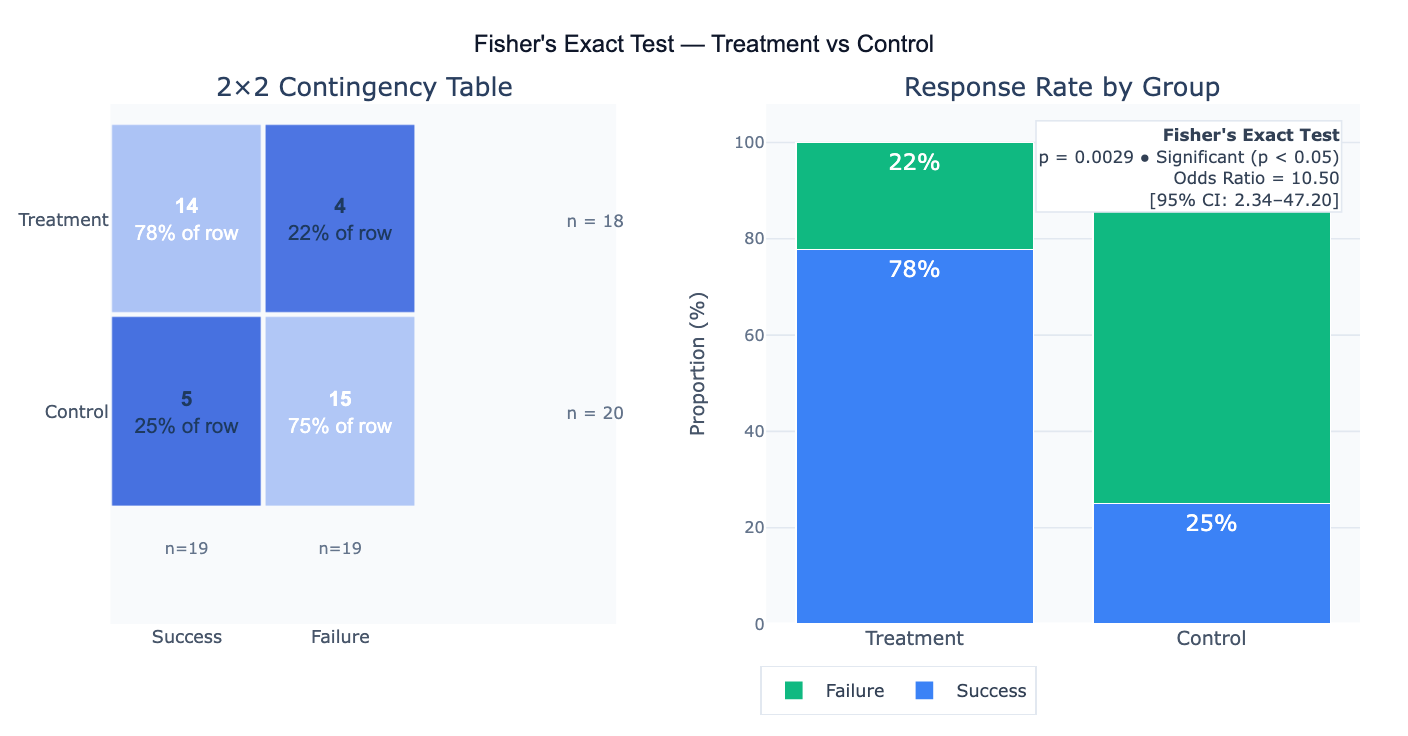
Preview
What Is Fisher's Exact Test?
Fisher's exact test is a non-parametric statistical test for evaluating whether two categorical variables are associated in a 2×2 contingency table. Unlike the chi-square test, which relies on a large-sample normal approximation, Fisher's test computes the exact probability of observing the data table (and all more extreme tables) under the null hypothesis that the two variables are independent, using the hypergeometric distribution. The test is exact in the sense that it produces the precise p-value without any approximation — making it valid regardless of sample size and the preferred test whenever any expected cell count is below 5. It was famously introduced by Ronald Fisher in 1935 using the "Lady Tasting Tea" experiment.
The test is appropriate for any situation where you want to compare a binary outcome between two groups: does the new drug have a higher response rate than placebo? Is the defect rate different between two production lines? Is disease prevalence different between two populations? The null hypothesis is that the odds ratio (OR) = 1 — the odds of the outcome are the same in both groups. The odds ratio is the primary effect size measure: OR = (a/b) / (c/d) = ad/bc, where a, b, c, d are the four cells of the 2×2 table (a = exposed+outcome, b = exposed+no outcome, c = unexposed+outcome, d = unexposed+no outcome). OR = 1 means no association; OR > 1 means the exposure is associated with higher odds of the outcome; OR < 1 means it is protective.
The exact 95% confidence interval on the odds ratio (Cornfield method or exact conditional method) complements the p-value by giving the range of plausible OR values consistent with the data. A wide CI — typical with small samples — reflects the imprecision inherent to small-n studies even when the OR is large. One-tailed vs two-tailed: the two-tailed p-value (default) tests OR ≠ 1; the one-tailed p-value tests OR > 1 or OR < 1 specifically. Use one-tailed only when the direction of association is prespecified before data collection.
How It Works
- Describe your 2×2 table — provide the four cell counts directly in your prompt, or describe the groups and outcomes and the AI will construct the table. No file upload is required for a single table.
- Specify the analysis — e.g. "two-tailed Fisher's exact test; report p-value, odds ratio, and exact 95% CI; plot a bar chart comparing proportions"
- Get full results — the AI writes Python code using scipy.stats.fisher_exact to compute the exact p-value, odds ratio, and confidence interval, then generates a visualization with the 2×2 table and proportion comparison
Upload a CSV or Excel file if you have raw data (individual rows with two binary columns) and want the AI to compute the contingency table first before running the test.
Interpreting the Results
| Output | What it means |
|---|---|
| p-value (two-tailed) | Probability of observing this table or more extreme ones under independence; < 0.05 = statistically significant association |
| Odds Ratio (OR) | ad/bc — ratio of odds in group 1 vs group 2; OR = 1 means no association |
| 95% CI on OR | Exact confidence interval; excludes 1.0 ⟺ p < 0.05 (two-tailed) |
| Relative Risk (RR) | a/(a+b) ÷ c/(c+d) — ratio of proportions; more intuitive than OR but only valid for prospective designs |
| Absolute Risk Difference | a/(a+b) − c/(c+d) — the raw difference in event rates; needed for NNT |
| NNT | Number needed to treat = 1 / absolute risk difference — patients treated per additional benefit |
| Exact probability table | All possible tables with the same marginals and their exact probabilities — the basis of the exact p-value |
Example Prompts
| Scenario | What to type |
|---|---|
| Basic 2×2 test | treatment: 14 success, 4 failure; control: 5 success, 15 failure — Fisher's exact test, two-tailed; OR and 95% CI |
| From raw data | upload CSV with 'group' (A/B) and 'outcome' (yes/no) columns; build 2×2 table; Fisher's exact test; bar chart of proportions |
| One-tailed test | is treatment significantly better than control (one-tailed)? table: [[8,2],[3,7]]; report one-tailed p-value and OR |
| Rare outcome | rare adverse event: treated group 2/200, placebo 0/200; Fisher's exact test; exact 95% CI on risk ratio |
| Multiple tables | run Fisher's exact test for each of 5 treatment-outcome pairs; apply Bonferroni correction; table of adjusted p-values |
| With visualization | 2×2 table [[14,4],[5,15]]; Fisher's test; plot 2×2 heatmap, proportion bars, and annotate OR with CI |
| NNT calculation | Fisher's test; report absolute risk reduction and number needed to treat (NNT) with 95% CI |
When to Use Fisher's Exact Test vs Chi-Square
- Use Fisher's exact test when any expected cell count < 5 (the chi-square approximation fails); always for 2×2 tables with small total n (< 30–40); when exact p-values are required (regulatory submissions, pre-clinical studies)
- Use the chi-square test when all expected counts ≥ 5 and total n is large (> 40–50); when the 2×2 extends to a larger r×c table (Fisher's exact generalizes but becomes computationally expensive); when the chi-square statistic itself is needed for power calculations
- Never use chi-square when any expected cell count < 1 or more than 20% of cells have expected count < 5 — use Fisher's exact instead
- For 2×2 tables, Fisher's exact is always valid and is increasingly preferred over chi-square even with large samples as a matter of principle; the two tests converge for large n
Frequently Asked Questions
Why does Fisher's exact test give a different p-value than chi-square on the same table?
The chi-square test uses a normal approximation to the hypergeometric distribution — as sample sizes grow, the approximation improves and the two tests converge. For small samples, chi-square underestimates the exact probability (gives a smaller p-value than it should), making it slightly anti-conservative. Fisher's exact test is always valid but can be conservative with two-tailed p-values (the standard doubling of the one-tailed p) when the distribution is skewed. The mid-p adjustment (p-value = P(more extreme) + 0.5 × P(observed)) reduces conservatism. In practice, with any expected cell count < 5, trust Fisher's exact over chi-square.
What is the odds ratio and how does it differ from relative risk? The odds ratio (OR = ad/bc) is the ratio of the odds of the outcome in group 1 versus group 2. The relative risk (RR = a/(a+b) / c/(c+d)) is the ratio of the outcome proportions. OR and RR tell similar stories when the outcome is rare (< 10%) because odds ≈ probability for rare events. When the outcome is common, OR overestimates the association relative to RR — an OR of 3 does not mean the risk is tripled unless the outcome rate is very low. Fisher's test reports the OR because it arises naturally from the hypergeometric model. For case-control studies (where disease is sampled by design), only the OR is valid — RR cannot be estimated. For cohort/RCT designs, RR is more intuitive and easier to communicate to non-statisticians.
Can Fisher's exact test handle larger tables (3×2, 3×3)?
Yes — scipy implements scipy.stats.chi2_contingency and the exact test can be applied to r×c tables using scipy.stats.fisher_exact only for 2×2; for larger tables, use scipy.stats.boschloo_exact (2×2), or for r×c tables use the Freeman-Halton extension (available in R's fisher.test but not directly in scipy). As table dimensions grow, the exact test becomes computationally intensive. For large sparse tables, the chi-square test with Yates correction is usually adequate; for 2×k comparisons, Barnard's exact test or Fisher's exact on each 2×2 subset with multiple testing correction is common practice. Ask the AI to "run Fisher's exact test across all pairwise comparisons of the 3 groups and apply Bonferroni correction".
My p-value is significant but the confidence interval on OR is very wide — what does that mean? A wide CI on the OR reflects the imprecision of the estimate — with small cell counts (even just one cell with n = 2–3), the hypergeometric distribution is spread out and OR can range from near 0 to very large values consistent with the data. A wide CI and a significant p-value together mean: you have evidence of an association (unlikely to be chance), but the magnitude of the effect is uncertain — the true OR could be small or very large. The appropriate response is to collect more data to narrow the CI, not to conclude the effect is large just because the point estimate is large.