Data analysis AIfor Excel, CSVs & Databases
Ask questions in plain English and get charts, statistics, and insights — no coding required.
Free to start No credit card required No coding needed
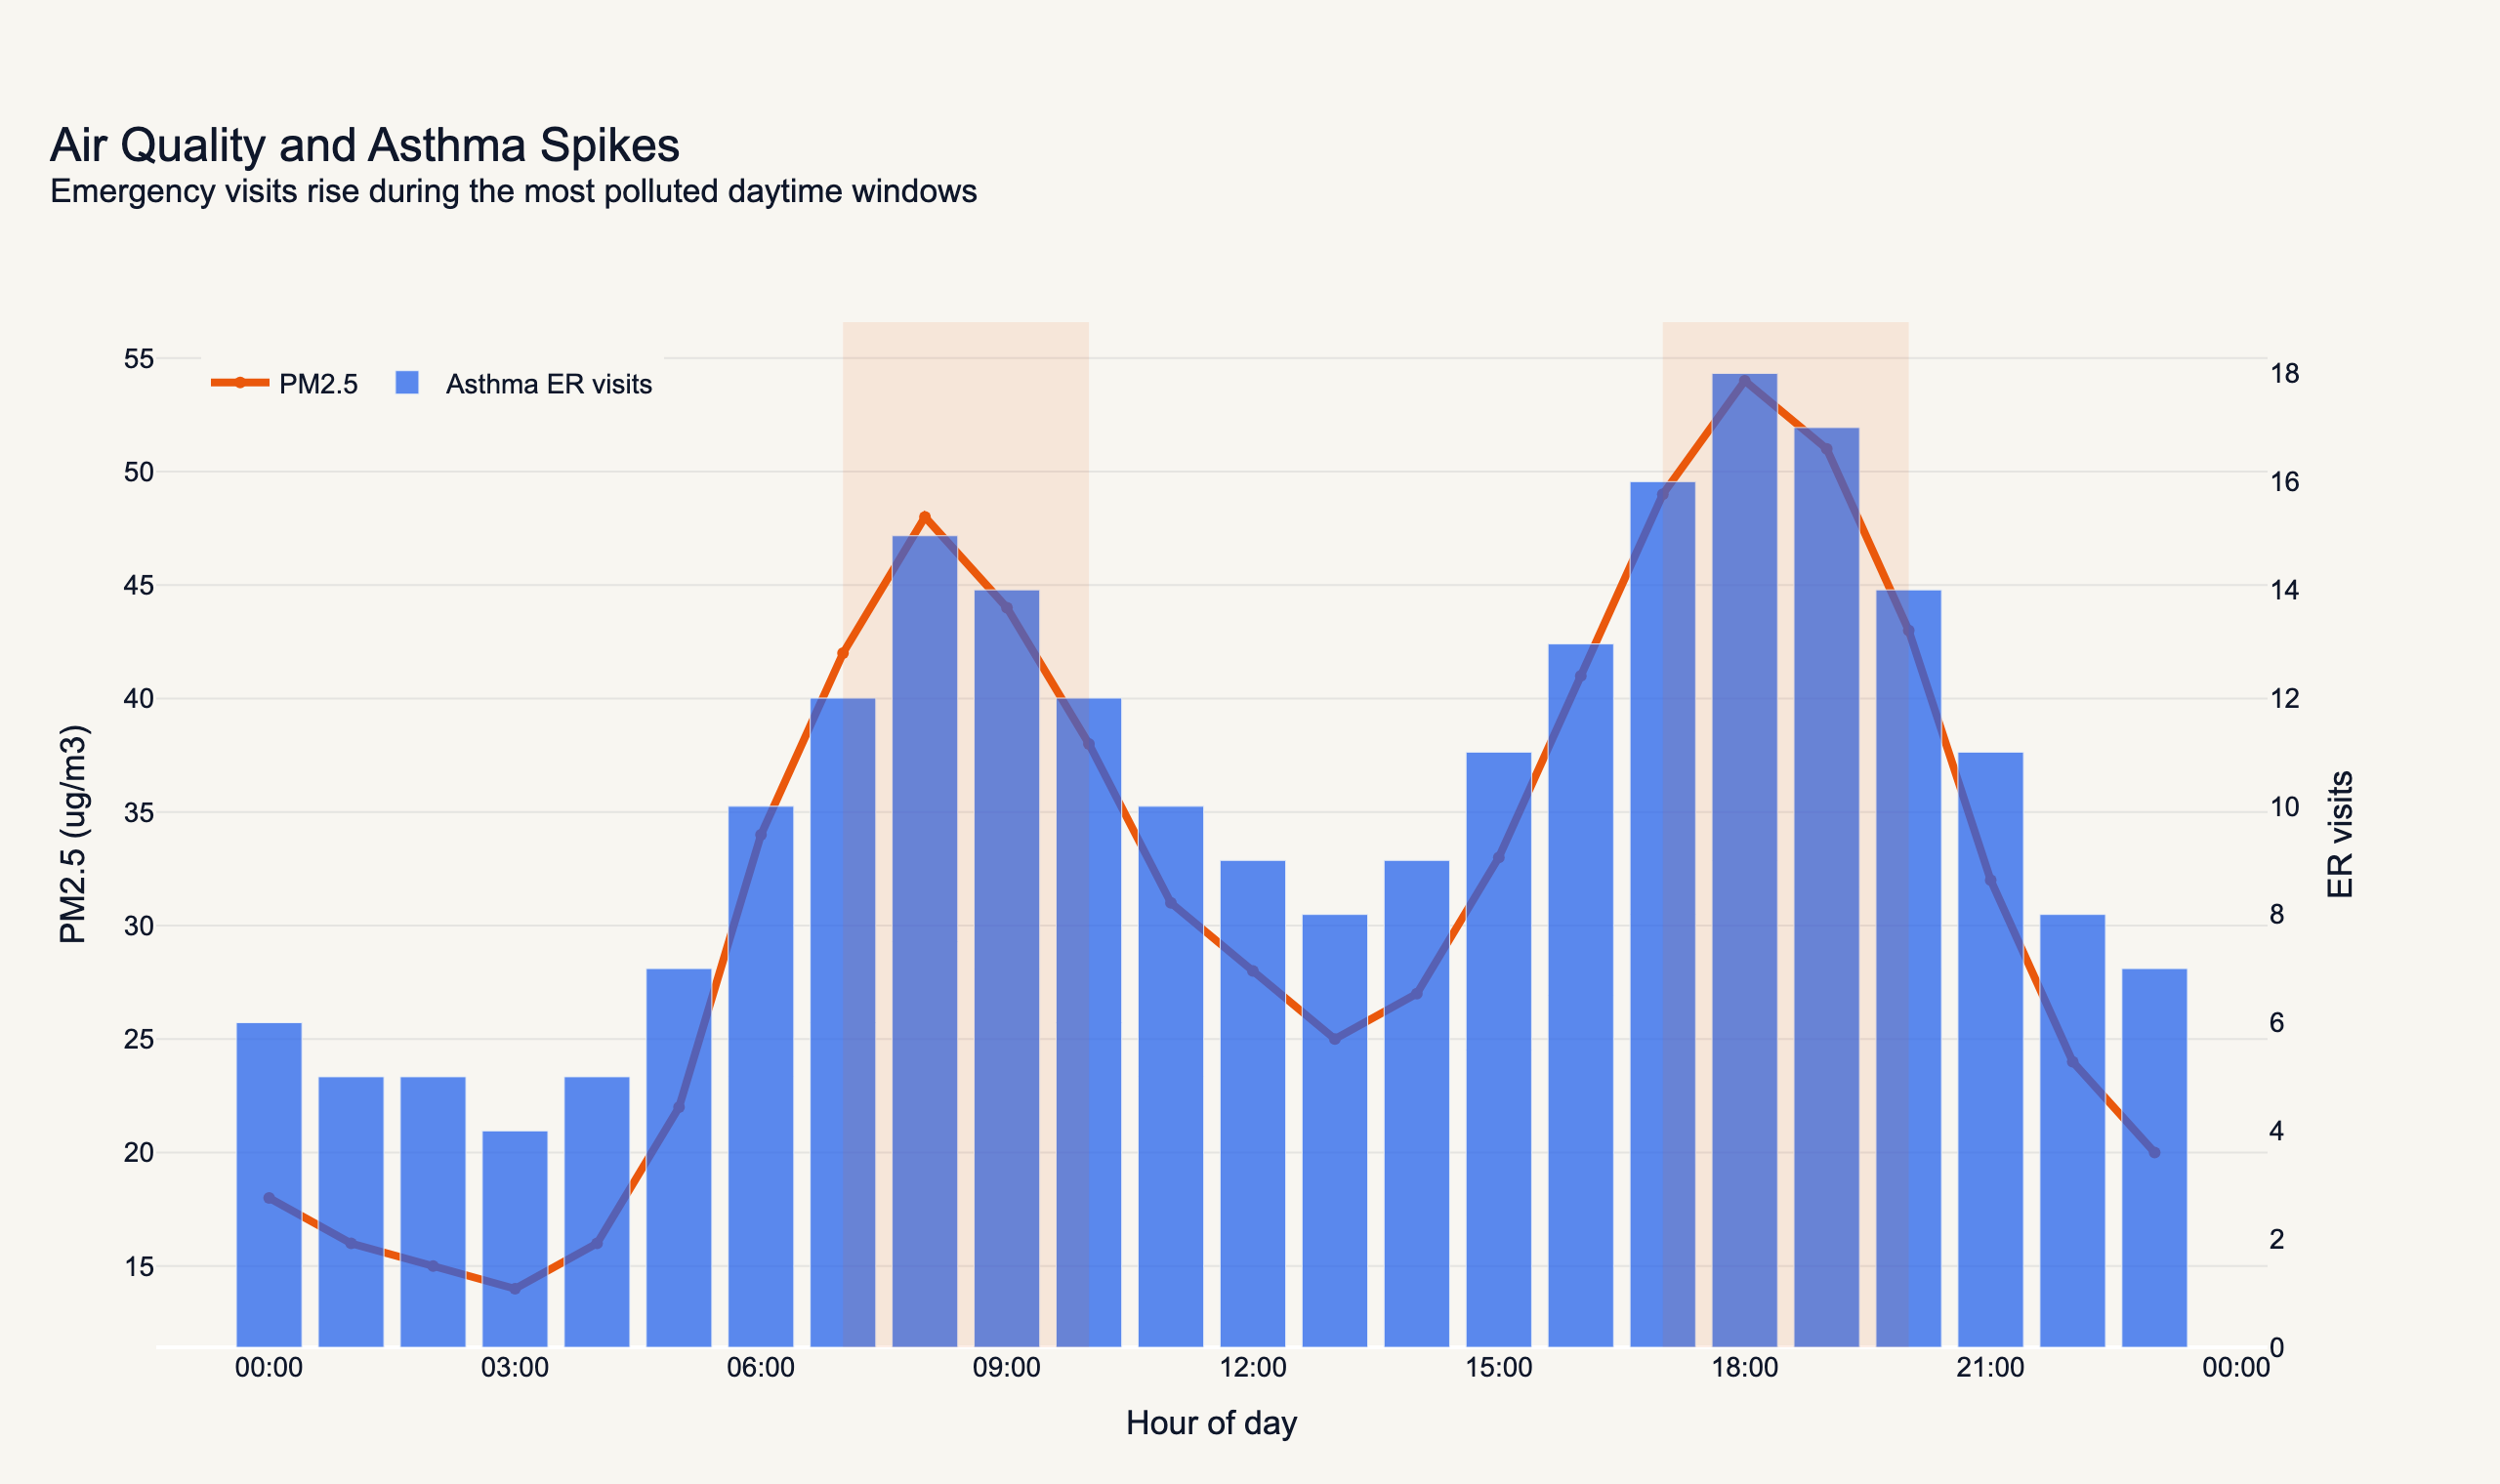
Show when pollution spikes align with asthma ER visits
Ask a follow-up
Use Cases
Keptune works across research, science, business, and beyond
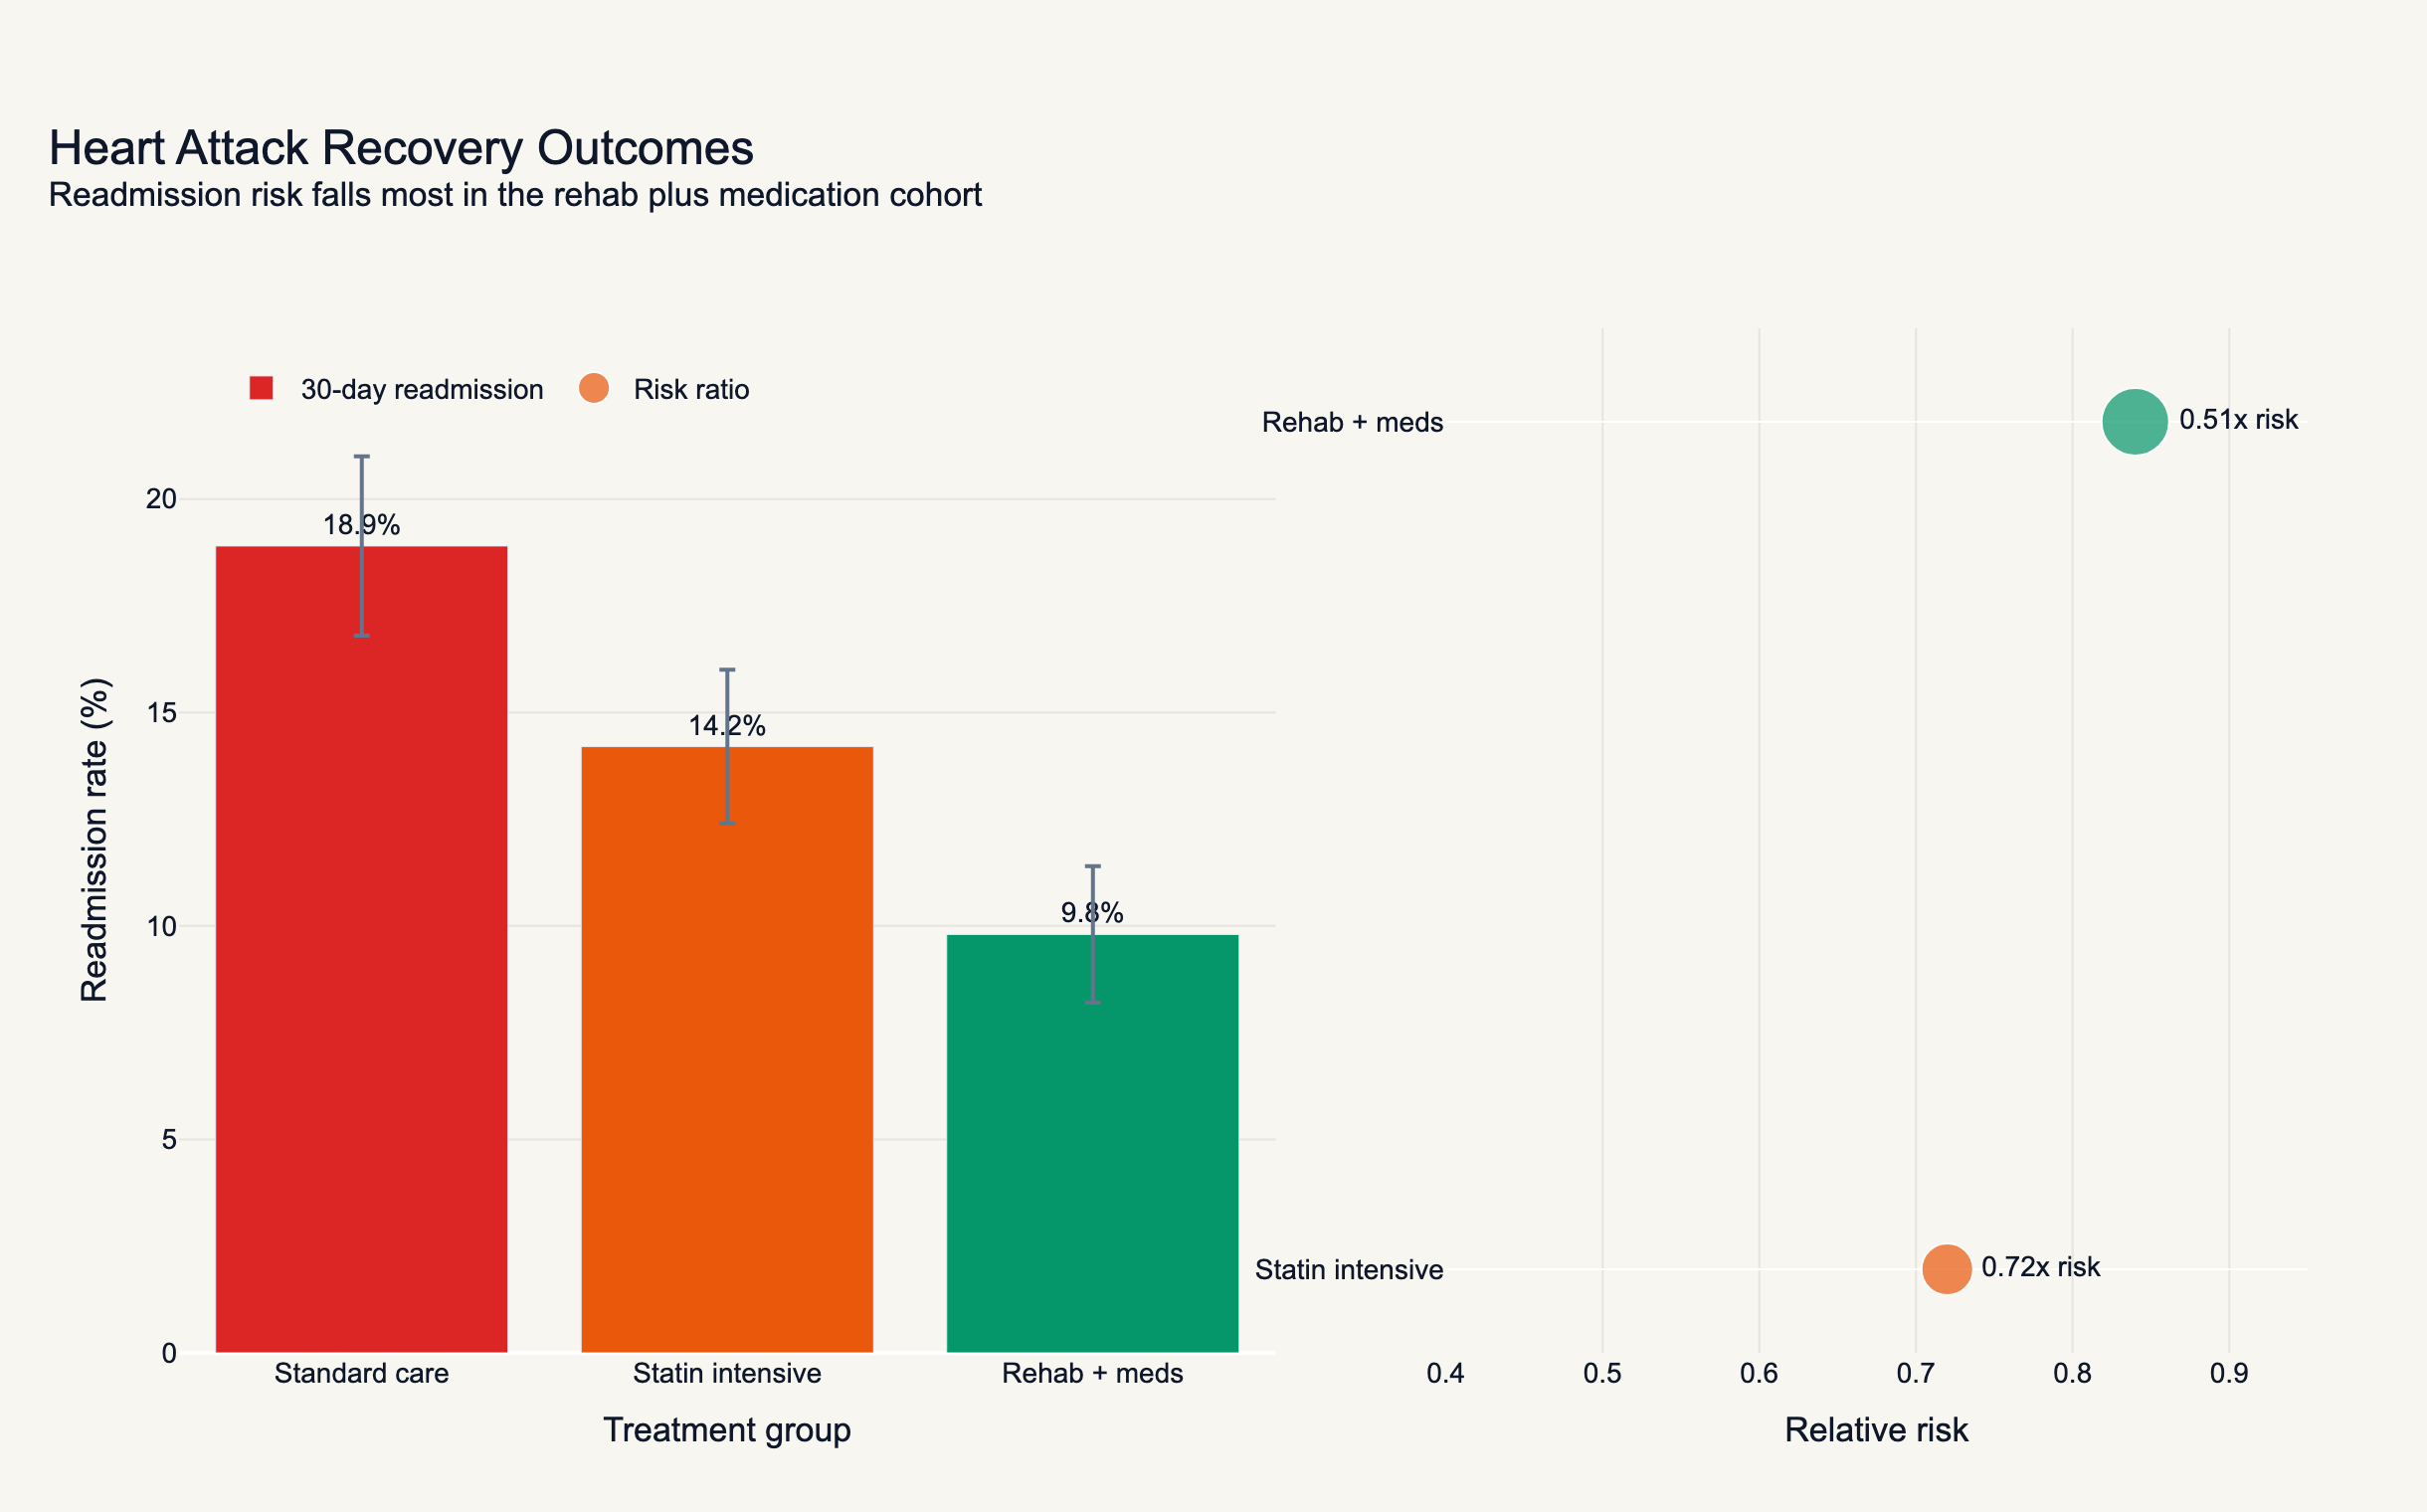
Compare heart attack readmission rates across treatment groups.
Features
Everything you need to analyze your data
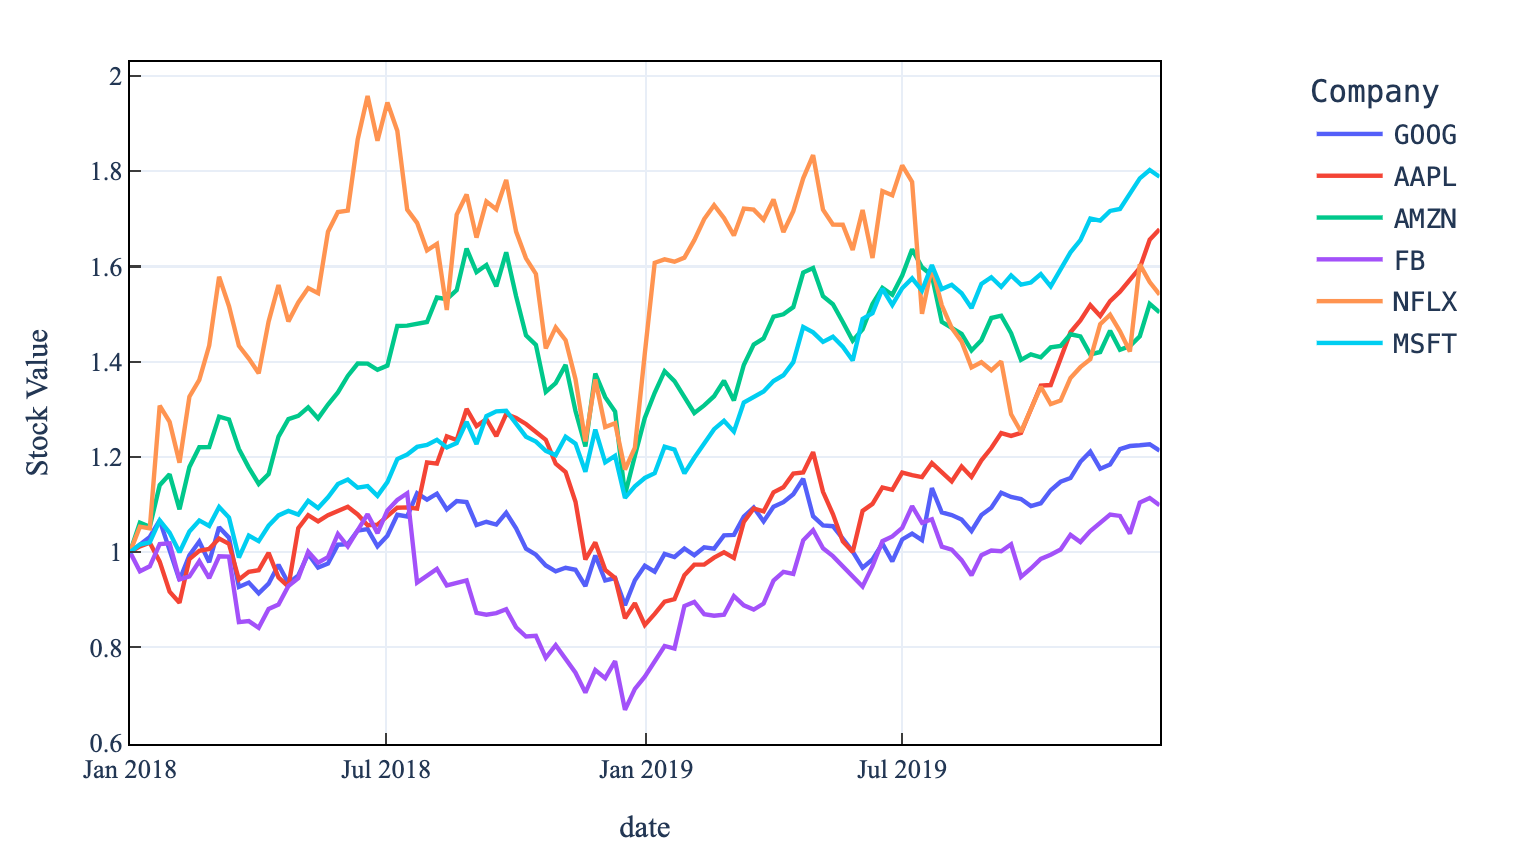
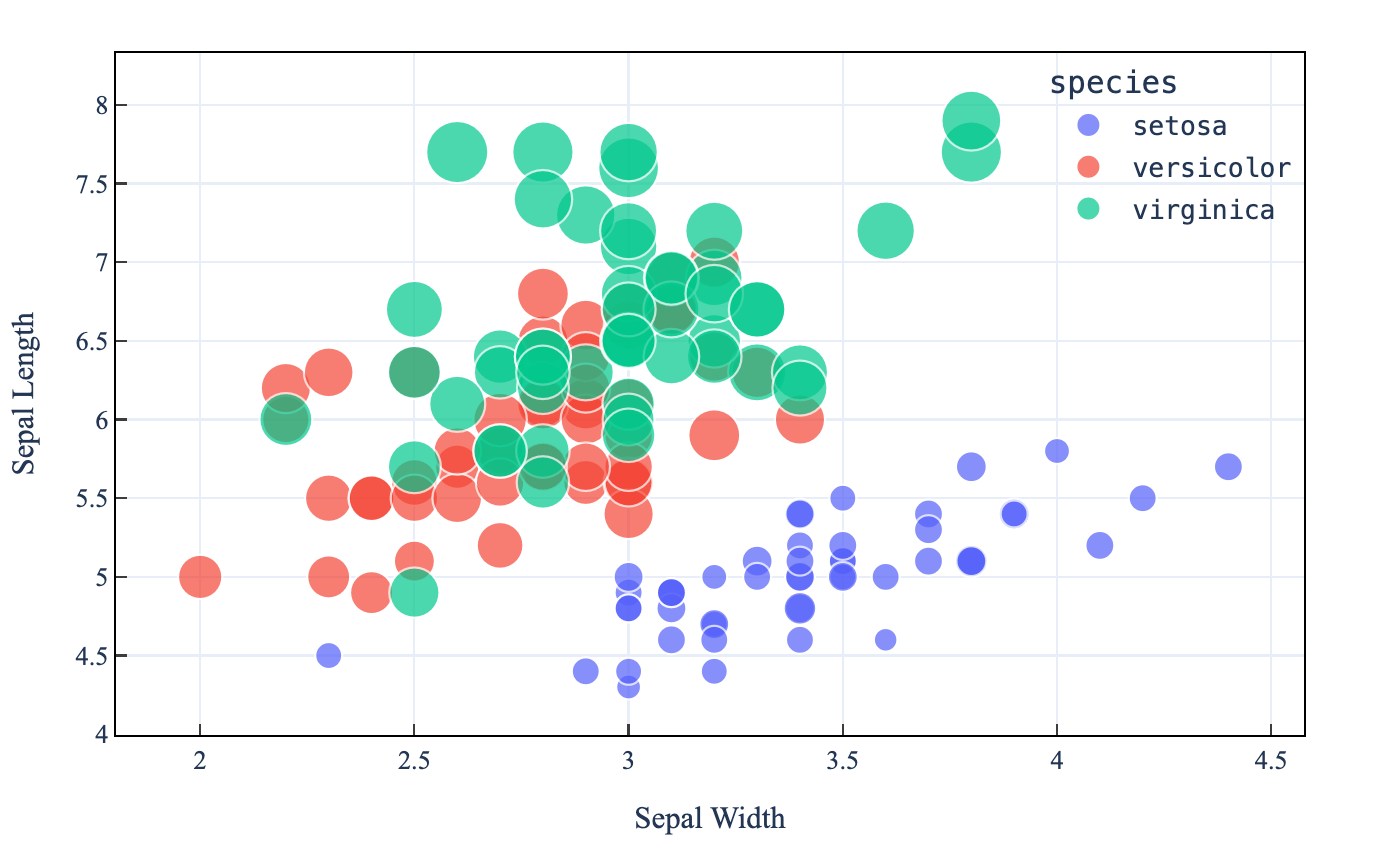
Unlock visually engaging stories hidden in your data.
Box plots·Bar plots·Histograms·Scatter plots·3D scatter plots·Line charts·Heatmaps·Swarm plots·Volcano plots·Manhattan plots·Violin plots
Plot life expectancy vs GDP per capita, sized by population.
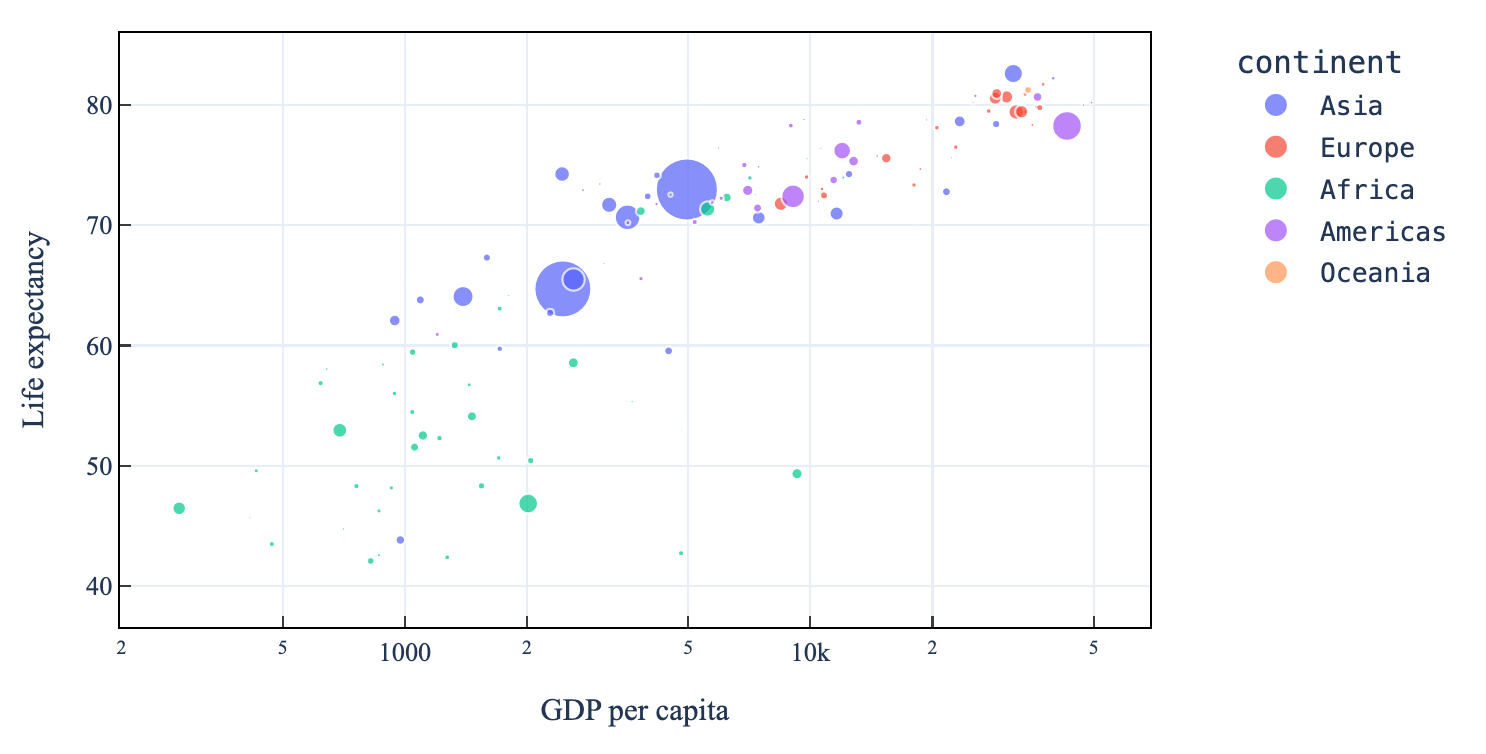
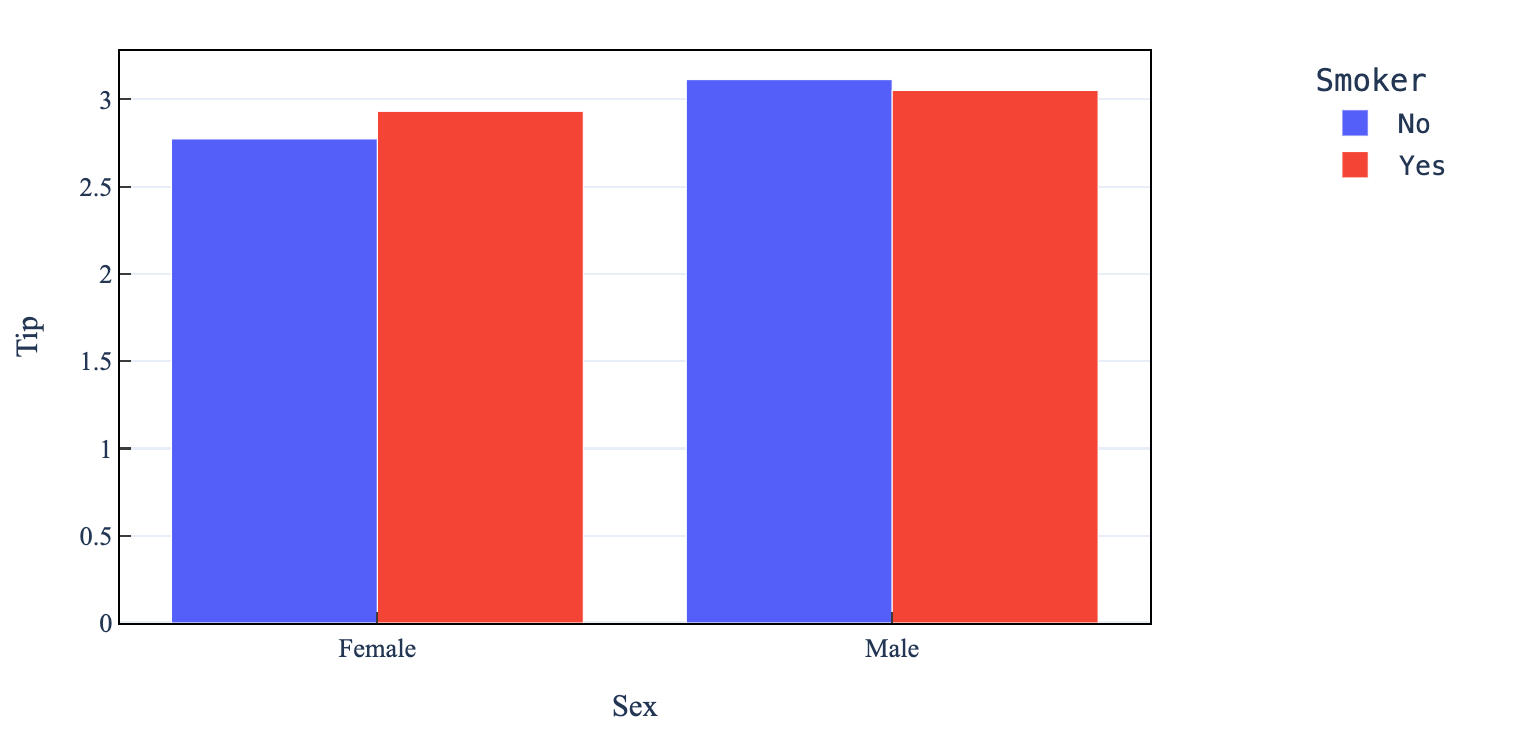
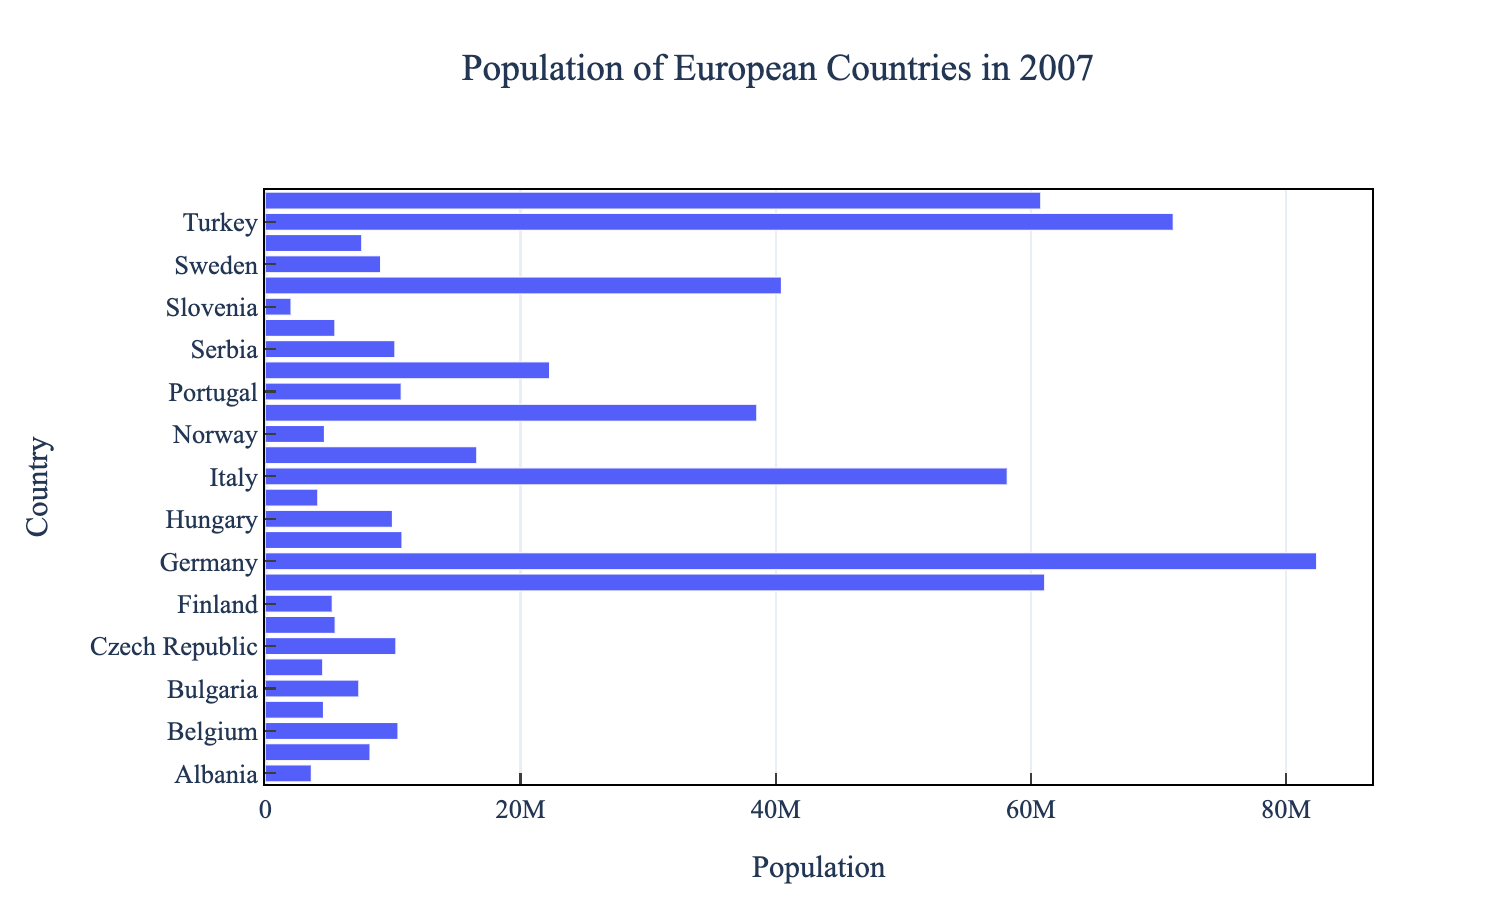
Box plots·Bar plots·Histograms·Scatter plots·3D scatter plots·Line charts·Heatmaps·Swarm plots·Volcano plots·Manhattan plots·Violin plots
Plot life expectancy vs GDP per capita, sized by population.
Pricing
Try it for free
Pay for higher usage
Advanced
$20/month
- Everything in the Basic plan
- 1000 prompts per month
- Longer chat history
- 250MB persistent storage
- Unlimited code executions
Most popular
Basic
$10/month
- Everything in the Lite plan
- 250 prompts per month
- 100MB persistent storage
Lite
$5/month
- Everything in the Free plan
- Premium AI models
- 50 prompts per month
- 20MB persistent storage
- Multiple data files
- Advanced plotting package
- Advanced statistics package
Free
$0/month
- 10 prompts per month
- Basic plotting package
- Basic statstics package
- Edit and run code
Looking for a student discount? Please email support [at] keptune.ai to get a 50% discount code on Basic or Advanced plan.
Ready to analyze your data?
Upload a file, connect a database, or pick a public dataset.
Free to start · No credit card required